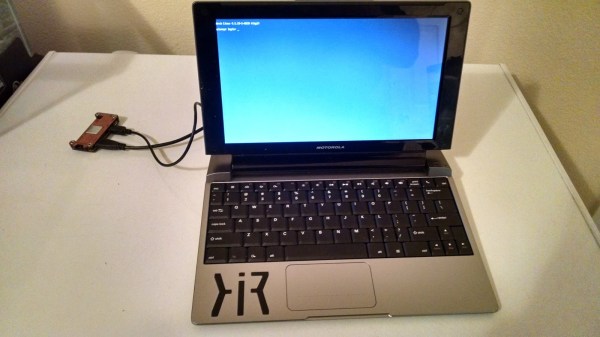
Collectively, the Hackaday readers sigh, “Not another Pi Zero hub!!!”. But [Sean Hodgins’] hub is different. It has a new angle, literally. Besides, it’s an entry in the Hackaday and Adafruit Pi Zero Contest .
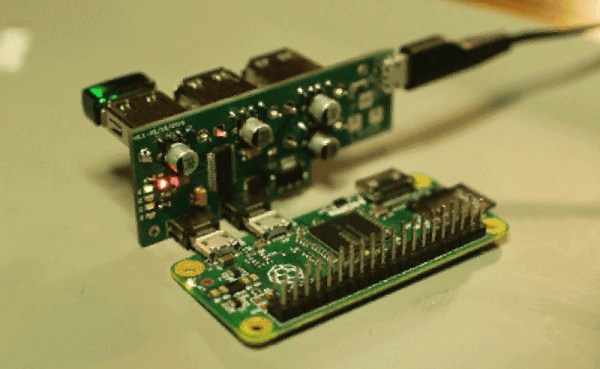
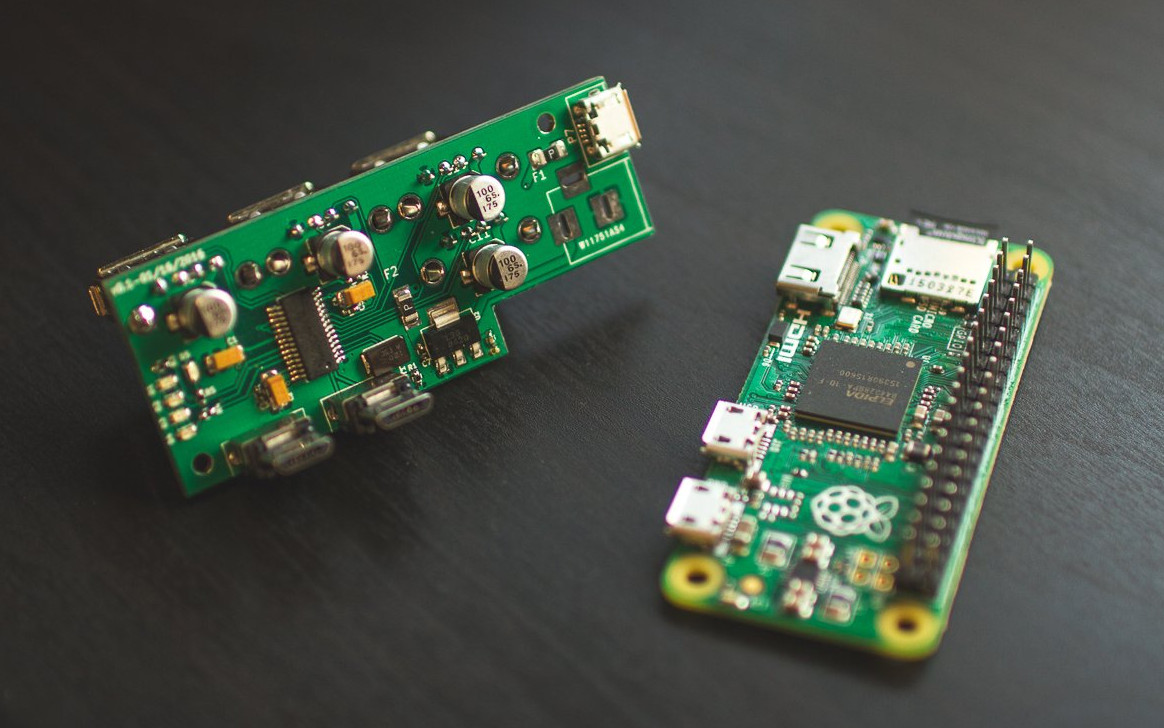 [Sean Hodgins’] acute approach is orthogonal to most of the other hubs we’ve seen. He’s mating the hub at right angles to the Zero. The hub plugs into both the on-the-go USB port and the USB power port. No extra cables or wiring needed. [Sean] plans to release the design on GitHub after his Kickstarter campaign ends. He’s supplying bare boards for those who like the smell of solder paste.
This project nicely triangulates the issues of adding a hub to the Zero. The physical connection is solid with the boards connecting via the USB connectors. Power is supplied through the hub the way the Pi expects, which means all the protections the Pi Foundation built into the onboard conditioning are left in place. This also reduces surge problems that might occur when back powering through a hub and hot swapping USB devices. Another neat feature is the notched corner leaving the HDMI port accessible. Similarly, the Pi’s GPIO pins are free of encumbrance. One drawback is the hub is fused at 2 amps, just like the Pi. It would be nice to have a little more headroom for power hungry USB devices. Maybe another 0.5 amp to allow for the Zero’s usage.
[Sean] snaps the two together after the break.



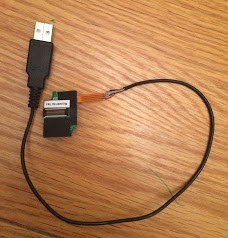 He found a cheap replacement fingerprint scanner on hacker’s heaven, also known as eBay. It had four wires attached to a 16 pin connector. Investigation on the scanner end showed the outer pair were power and ground which made [Serge] suspect it was a USB device. Wiring up a USB connector and trying it the device was recognized but with a lot of errors. He swapped the signal lines and everything was perfect. He had sudo at his finger tip.