Inspect The RF Realm With Augmented Reality

Intellectually, we all know that we exist in a complex soup of RF energy. Cellular, WiFi, TV, public service radio, radar, ISM-band transmissions from everything from thermometers to garage door openers — it’s all around us. It would be great to see these transmissions, but alas, most of us don’t come from the factory with the correct equipment.

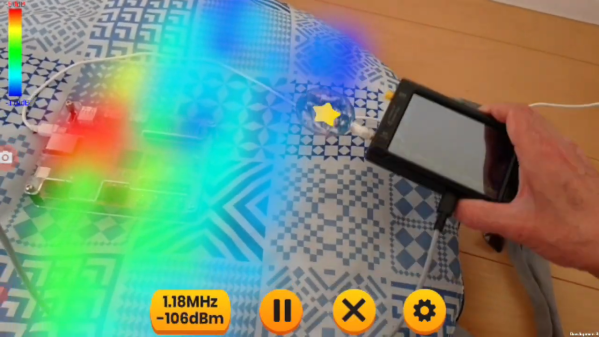
Luckily, aftermarket accessories like RadioFieldAR by [Manahiyo] make it possible to visualize RF signals. As the name suggests, this is an augmented reality system that lets you inspect the RF world around you. The core of the system is a tinySA, a pocket-sized spectrum analyzer that acts as a broadband receiver. A special antenna is connected to the tinySA; unfortunately, there are no specifics on the antenna other than it needs to have a label with an image of the Earth attached to it, for antenna tracking purposes. The tinySA is connected to an Android phone — one that supports Google’s ARCore — by a USB OTG cable, and a special app on the phone runs the show.

By slowly moving the antenna around in the field of view of the phone’s camera, a heat map of signal strength at a particular frequency is slowly built up. The video below shows it in action, and the results are pretty cool. If you don’t have a tinySA, fear not — [Manahiyo] has a version of the app that supports a plain old RTL-SDR dongle too. That should make it easy for just about anyone to try this out.

And if you’re feeling deja vu about this, you’re probably remembering the [Manahiyo]’s VR spectrum analyzer, upon which this project is based.

Continue reading “Inspect The RF Realm With Augmented Reality” →
Near Field EMI Probes: Any Good?

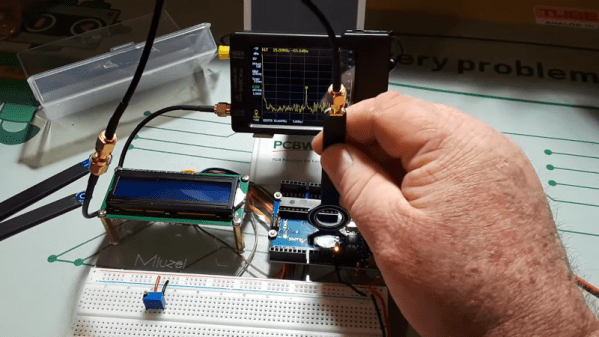
[Learnelectronics] purchased some near-field EMI probes for his tiny spectrum analyzer for about $5 on sale. Could they be any good at that price? Watch the video below and find out.

The probes arrived as a kit with four probes: three circular ones for sensing the H field and a stubby probe for sensing E fields (although the video gets this backward, by the way). There’s not much to them, but for the price, it probably isn’t worth making them yourself if your concern is the cost. Now, if you just want to make your own, we get that, too, but don’t expect to save much money.

Continue reading “Near Field EMI Probes: Any Good?” →

Say The Magic Word, And The TinySA Goes Ultra

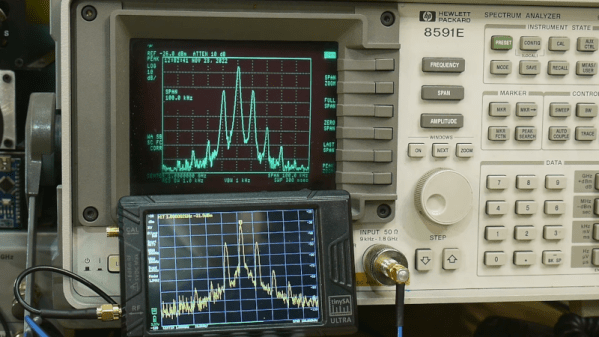
We’ve looked at the TinySA spectrum analyzer in the past. However, the recent Ultra edition offers an increase in range from 800 MHz to 6 GHz. How does it work? [IMSAI Guy] tells us in a recent video that you can watch below. In addition to an increased frequency range, the new device offers a larger display and enhancements to the signal generator and bandpass filtering. It also has an optional LNA. All this, of course, is at a price since the Ultra sells at a little more than twice the original unit’s price. Still, $120 or so for a 6 GHz spectrum analyzer isn’t bad.

For some reason, you have to put a passcode in to enable the Ultra mode, although the passcode appears to be common knowledge and available on the device’s wiki. You can presume they could, at some point, make this feature or others require a paid passcode, but for now, it is just a minor inconvenience. Reminds us of a certain oscilloscope that’s become quite popular in our community.

One thing you should be aware of, however, is that the Ultra mode uses a mixer to downconvert the incoming signal to the ordinary 800 MHz range. That means, as you can see in the video, that the local oscillator puts out some signal at the input. The level is relatively low, but still something to be aware of if you are trying to make a precision measurement.

The video compares the device to an HP 8591E spectrum analyzer. It tops out at 1.8 GHz and runs about $2,500 new. Even on eBay, you can expect to pay between $500 and $1000 for one of these. The results seem to be comparable, for the most part.

We looked at the device’s predecessor back in 2020. We also did a full-blown review a little bit later.

Continue reading “Say The Magic Word, And The TinySA Goes Ultra” →

Balancing A Motor With An Oscilloscope

With all things in life, one must seek to achieve balance. That may sound a little like New Age woo-woo, but if you think it’s not literally true, just try tolerating a washing machine with a single comforter on spin cycle, or driving a few miles on unbalanced tires.

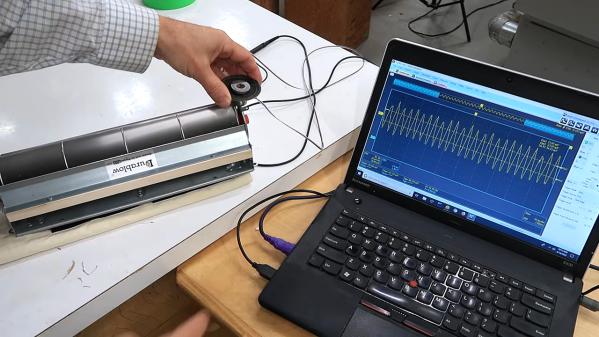
Anything that rotates can quickly spin itself into shrapnel if it’s not properly balanced, and the DIY power tools in [Matthias Wandel]’s shop are no exception. Recent upgrades to his jointer have left the tool a bit noisy, so he’s exploring machine vibrations with this simple but clever setup. Using nothing but a cheap loudspeaker and an oscilloscope, [Matthias] was able to characterize vibrations in a small squirrel-cage blower — he wisely chose to start small to validate his method before diving into the potentially dangerous jointer. There was quite a lot to be learned from the complex waveforms coming back from the transducer, analysis of which was greatly helped by the scope’s spectrum analyzer function. The video below shows the process of probing various parts of the blower, differentiating spectral peaks due to electrical noise rather than vibration, and actually using the setup to dynamically balance the fan.

We’d rate this as yet another handy shop tip from [Matthias], and we’ll be looking out for the analysis of his jointer. Want to do the same but you don’t have an oscilloscope? No problem — an earbud and Audacity might be all you need.

Continue reading “Balancing A Motor With An Oscilloscope” →

Character VFD Becomes Spectrum Analyzer

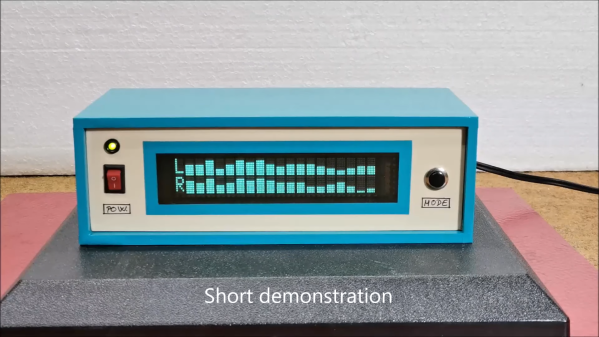
These days, streaming services are a great way to listen to music or podcasts on your computer or on the go. However, they lack one feature of the MP3 players and streamers of old: visualizations! [mircemk] is a fan of those, and has built a hardware spectrum analyzer that pumps with the music.

The build relies on a 20×2 character VFD display that looks great, with high brightness and excellent contrast. It can be easily driven from a microcontroller, as it has a controller on board compatible with the typical HD44780 command set. On Arduino platforms, this means the display can easily be driven with the popular LiquidCrystal library.

The Arduino Nano inside takes in the audio signal via its analog inputs. It then processes the audio with the fix_fft library, which runs a Fast Fourier Transform in order to figure out the energy level of each frequency bin in the audio spectrum for both the left and right channels. This data is then sent to the screen for display. It’s impressively fast and smooth, with the display dancing along with the beat nicely as [mircemk] tests it out with some tunes.

If it looks familiar, it’s because it’s an updated version of a prior project from [mircemk]. We saw it previously as a VU meter that pulsed with the beat, an altogether simpler visualization but still a cool one. Video after the break.

Continue reading “Character VFD Becomes Spectrum Analyzer” →

Big Audio Visualizer Pumps With The Music

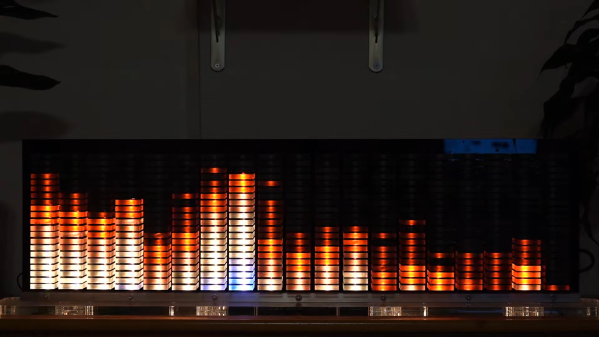
A spectrum analyzer is a great way to create exciting visuals that pulse in time with music. [pyrograf] wanted a big one as a display piece, so set about whipping up something of their very own.

An ESP32 microcontroller serves as the heart of the build, with its high clock rate and dual cores making it a highly capable choice for the job. Audio from a microphone is amplified and pumped into the ESP32’s analog input. Core 0 on the ESP32 then runs a Fast Fourier Transform on the input audio in order to determine the energy in each frequency band. The results of this FFT are then passed to Core 1, which is used to calculate the required animations and pipe them out to a series of WS2812B LEDs.

Where this build really shines, though, is in the actual construction. Big chunks of acrylic serve as diffusers for the LEDs which light up each segment of the spectrum display. Combine the big pixel size with a nice smooth 30 Hz refresh rate on the LEDs, and the result is a rather large spectrum analyzer that really does look the business.

We’ve seen some similar builds over the years, too. Video after the break.

Continue reading “Big Audio Visualizer Pumps With The Music” →

Pluto Spectrum Analyzer Uses Command Line

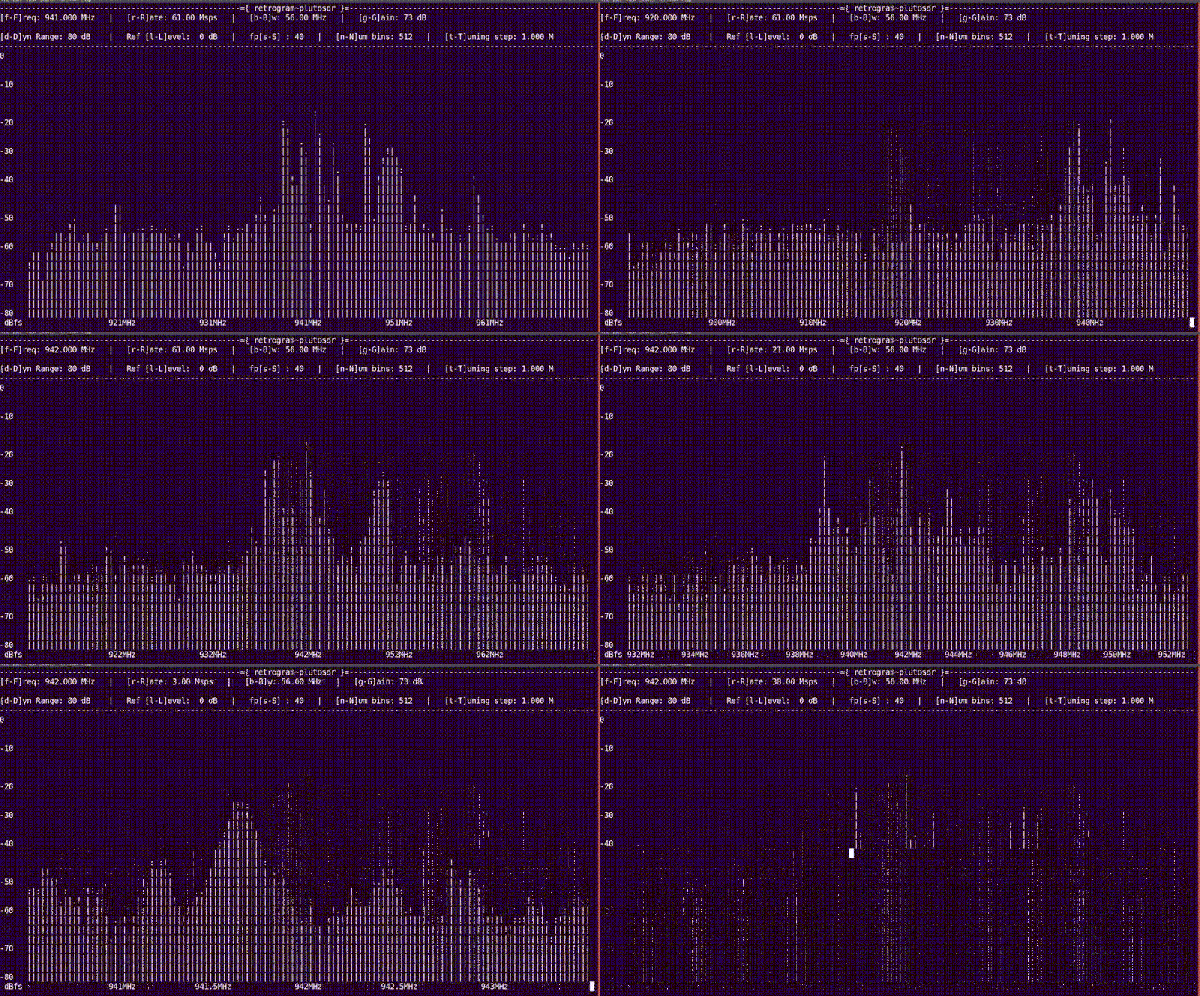
If you don’t care about shortwave frequencies, the PlutoSDR is a great deal. The device is supposed to be an evaluation board for Analog Device’s radio chips, but it does great as a software-defined radio that can receive and transmit and it even runs Linux internally. [SignalsEverywhere] shows how to use it as a spectrum analyzer that works from the command line in the video you can see below.

The software used is Retrogram. Despite the ASCII graphics, the program has many features. You can use simple keystrokes to change the center frequency, the sampling rate, the bandwidth, and more. You can run the software on a Linux host or compile a binary on the box or cross-compile using tools on the Raspberry Pi.

Continue reading “Pluto Spectrum Analyzer Uses Command Line” →