We don’t see that many PSP hacks around these parts, perhaps because the system never attained the same sort of generational following that Nintendo’s Game Boy line obtained during its heyday. Which is a shame, as it’s really a rather nice system with plenty of hacking potential. Its big size makes it a bit easier to graft new hardware into, the controls are great, and there’s no shortage of them on the second-hand market.
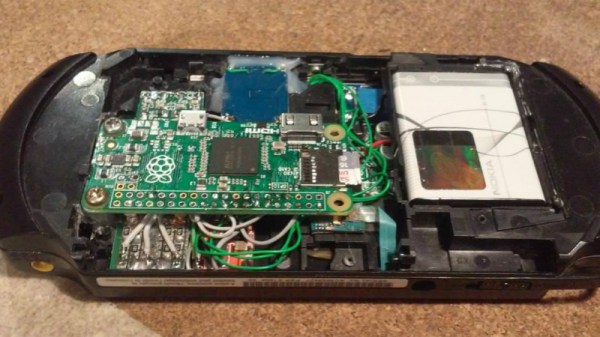
 Hopefully, projects like this incredible “PiSP” from [Drygol] will inspire more hackers to take a second look at Sony’s valiant attempt at dethroning Nintendo as the portable king. With his usual attention to detail, he managed to replace the PSP’s original internals with a Pi Zero running RetroPie, while keeping the outside of the system looking almost perfectly stock. It wasn’t exactly a walk in the park, but we’d say the end definitely justifies the means.
The first half of the project was relatively painless. [Drygol] stripped out all the original internals and installed a new LCD which fit so well it looks like the thing was made for the PSP. He then added a USB Li-ion charger board (complete with “light pipe” made out of 3D printer filament), and an audio board to get sound out of the usually mute Pi Zero. He had some problems getting everything to fit inside of the case. The solution was using flat lithium batteries from an old Nokia cell phone to slim things down just enough to close up the PSP’s case with some magnets.
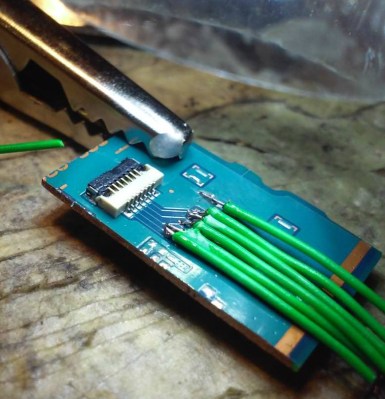
What ended up being the hardest part of the build was getting the original controls working. [Dyrgol] wanted to use the original ZIF connector on the PSP’s motherboard so he wouldn’t have to modify the stock ribbon cable. But it was one of those things that was easier said than done. Cutting out the section of PCB with the connector on it was no problem, but it took a steady hand and a USB microscope to solder all the wires to its traces. But the end result is definitely a nice touch and makes for a cleaner installation.
We’ve covered the exciting world of PSP homebrew, and even DIY batteries built to address the lack of original hardware, but it’s been fairly quiet for the last few years. Here’s hoping this isn’t the last we’ve seen of Sony’s slick handheld on these pages.
Continue reading “Stock Looking PSP Hides A Raspberry Pi Zero”

