Collecting Radon Data In The Name Of Science And Safety

radon-data-collector

When [Chris Nafis] built an addition onto his historical home he found that a Radon problem, previously mitigated with plenty of concrete, seemed to rear its ugly head yet again. He eventually resigned himself to installing a Radon fan and detector – the latter of which offered no way to store measurement data. He wanted to get a better feel for the short and long-term Radon measurements in his house, in hopes of finding some correlation between temperature, moisture levels, and the total amount of Radon emitted from the ground.

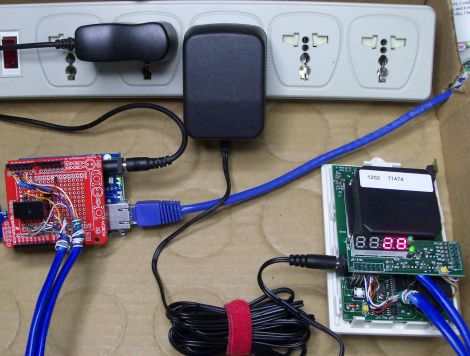
To do this, he disassembled a pair of Radon detectors located in different parts of his house, each of which he wired up to an Arduino. Using his oscilloscope to determine which PCB leads controlled the different LED segments on the displays, he quickly had the Arduinos scraping measurement data from the sensors. [Chris] figured the best way to keep track of his data was to do it online, so he interfaced the microcontrollers with Pachube, where he can easily analyze his historical readings.

An additional goal he set for himself is to trigger the Radon fan only when levels start rising in order to save a little on his electric bill. With his data logging operation in full swing, we think it should be a easy task to accomplish.

arduino-seismic-sensor

Detecting Seismic Waves With A Piezo Element

While we normally see piezo elements being used to output audio, [Veedo] thought that they could be used in a more useful manner. He bought way too many piezo film tabs and decided to use them to build a makeshift seismic sensor.

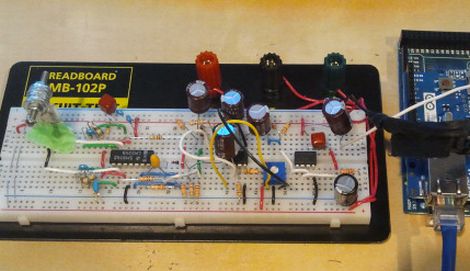
The piezo tabs came with weights attached at one end, though while testing them, he found that they more or less only detected vibrations with frequencies in the KHz range. Since earthquakes tend to produce vibrations in the 30-80 Hz range, he had to tweak his setup to detect the proper frequencies. To do this, he attached a weight made of a screw and washers, checking the output signals on his oscilloscope until the dominant sensed frequencies were in the range of 40 Hz.

The sensor was attached to a breadboard, then wired through a charge amp to create a small AC signal, which floats on 2.5Vdc. The bottom half of the wave is chopped off with a diode, after which it is fed into an Arduino Mega. The seismic data is then pushed up to his Pachube account for storage, though he can view the feeds locally via the a web server programmed into the Arduino.

We’re not sure how much advanced notice this sort of setup would give you in the event of an earthquake, but it seems like a fun project to build either way.

Extend Your Personal Weather Station’s Reporting Capabilities

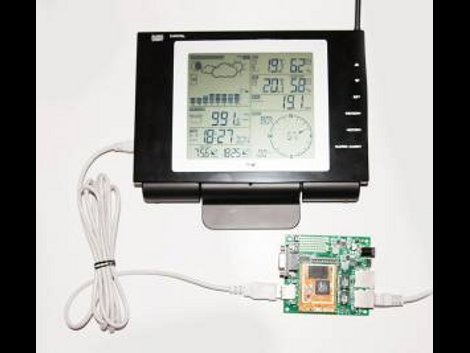
This Nexus wireless weather station has an array of weather sensors that you mount outside and monitor on the LCD screen. It also has the ability to stream the data over USB, but that feature is only supported in Windows and the companion software leaves a lot to be desired. Here’s a technique that will let you unlock the potential of the data by streaming it to your Linux box or directly to the Internet.

It turns out that grabbing the data via Linux has been made quite easy thanks to a package called TE923 (translated). With the base unit connected via USB, the software will pull down a string of colon-separated data which will be easy to parse using your favorite scripting language. But what if you don’t want to tether this to a computer?

The project goes one step further by using a Carambola board. This is a WiFi board with a USB port on it. It runs OpenWRT so getting TE923 going is as simple as building the package. The best part is, any wireless router that runs OpenWRT (or DD-WRT, etc.) and has a USB port can substitute for this board. With the module connected to the station, data is pushed to the Pachube website to serve as a custom web readout.

[Thanks Saulius]

Data Scraping And Visualization With Python

arduino_dial

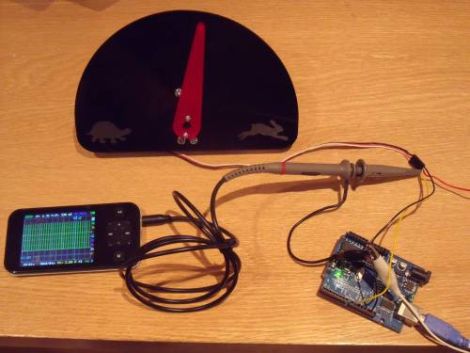
[Greg] built himself a small indicator dial with his laser cutter, and wanted to use it for visualizing server performance and load information. Before he started using it for server monitoring however, he thought he should test out his data parsing skills on a simpler data set.

Pachube has a wealth of information that can be freely used for whatever project you might have in mind, so [Greg] started looking around for something interesting to track. Eventually he located the data feed for a tanker ship and wired his dial to display the ship’s speed. He uses a Python script to interface with the Pachube API, which is fed to his Netduino board. A servo motor then changes the position of the dial based on the feed’s data. Since large tankers don’t change speed often, the experiment was a bit of a letdown. He searched for a bit and tuned into another feed that tracked wind speed in New Zealand, getting much better results.

His future plans include hooking it directly to his network and eventually using it to monitor his servers…at least once the novelty of tracking random data feeds wears off.

All of his code is available on GitHub, and he is happy to make a gauge for anyone who is interested, though he doesn’t currently list a price.

Arduino + Augmented Reality

[youtube=http://www.youtube.com/watch?v=sxr8oaRUq6k]

In this video you can see the marriage of Arduino data collecting units and Augmented reality systems. Set up by the people at pachube.com, a site for sharing sensor information from your location, this is an interesting idea. We can see that each unit has its own pattern, so it can have the data it is collecting superimposed on it in 3d. While this is really cool looking, we’re still trying to figure out what the use of this is? Who is going to be wandering around their office with a camera hooked to a computer? Maybe this is meant more for phones, so you can get quick readings off of the units without having to go access their logs. Since we know how much you guys absolutely love the Arduino, we though you might also be interested in this larger than life portrait we saw floating around.

[via littlebirdceo]