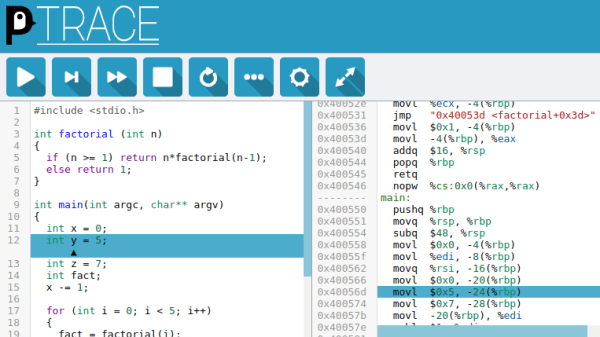
C-programmers who don’t have a mental model of what’s going on underneath their thin veneer of abstraction above assembly code are destined for trouble. In order to provide a convenient way to understand what C-code gets compiled to and how it runs on the machine, [Alex Beharrell] has created penguinTrace, a program which allows you to see what instructions your code compiles to, and examine how it executes.
While you can get somewhat similar functionality out of standard debuggers, penguinTrace was purpose-built to facilitate exploration of how the whole process works. You can single-step through the instructions your code compiled to, examine variables, and look at the stack — the usual debugger stuff — but structured more for exploration and learning than full-on debugging. Based on our experiences when we learned low-level programming, anything that can help novices build that all-important mental picture of what’s going on underneath is a good thing. But, since it was written with a secondary purpose of learning how debuggers themselves work, it’s a great opportunity for exploring that space, too.
The UI harnesses CodeMirror to provide a browser-based interface, and is configurable to use Clang or GCC for compilation. It supports AMD64/X86-64 and AArch64 architectures, and will run on Windows using WSL: if you’ve got a PC running Linux, a Raspberry Pi, or a Windows box, you’re good to go. The code is AGPL-licensed and available on GitHub. So, if you want to gain a better understanding of what happens when you compile and run “hello, world,” grab a copy and start exploring.
This isn’t the only way to debug, though – we previously featured an application that allows a type of debugging for the Arduino platform.

