Mathematical Proof The Eagle In The USPS Logo Is FAST!

The logo for the United States Postal Service is a mean-looking eagle. But a true fluid dynamics geek might look at it and realize that eagle is moving so fast it’s causing a shock wave. But just how fast is it moving? [Andrew Higgins] asked and answered this question, posting his analysis of the logo’s supersonic travel. He claims it’s Mach 4.9, but, how do we know? Science!

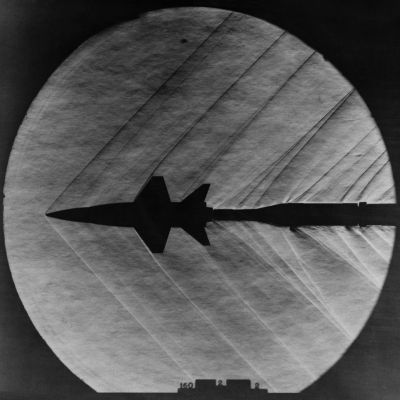
It turns out if something is going fast enough, you can tell just how fast with a simple picture! We’ve all seen pictures of jets breaking the sound barrier, this gives us information about the jet’s speed.

Mach Lines

How does it work?

Think about it like this: sound moves at roughly 330 m/s on Earth at sea level. If an object moves through air at that velocity, the air disturbances are transmitted as sound waves. If it’s moving faster than sound, those waves get distributed downstream, behind the moving object. The distance of these waves behind the moving object is dependent on the object’s speed.

This creates a line of these interactions known as a “Mach line.” Find the angle difference of the Mach line and the direction of travel and you have the “Mach angle” (denoted by α or µ).

There is a simple formula for determining the speed of an object using the Mach angle, the speed of sound (a), and an object’s velocity (v): sin(µ) = a / v.  The ratio of to a is known as the Mach number, (M). If an object is going exactly the speed of sound, it’s going Mach 1 (because v = a).

Since Mach number (M) is v / a, we can plug it into the formula from above as 1 / M and use [Andrew]’s calculation shown in the image at the top of the article for a Mach angle (µ) of ~11.7°:

\bf \sin ( \mu ) = \frac{1}{M} \\ \\ M = \frac{1}{\sin(\mu)} \\ \\ M = \frac{1}{\sin(11.7)} \\ \\ M = \frac{1}{0.202787295357} \\ \\ M = 4.9312753949380048

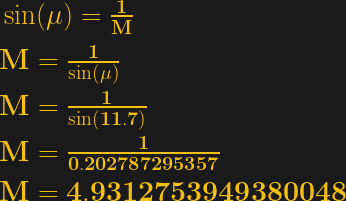
The real question is, did the USPS chose Mach 4.93 as a hint to some secret government postal project? Or, was it simply a 1993 logo designer’s attempt to “capture the ethos of a modern era which continues today”?

Think IN18s Are Cool? Get A Load Of This Must-Have Custom Nixie Tube

Us: “I’ll take Retro style displays we absolutely have to have for $200, Alex.”

Trebek: “This nixie tube is unlike any conventional tube you’ve seen before, handbuilt and NOT numbers or letters.”

Us: “What is FriendlyWire’s new logo tube?”

Trebek: “Heck yeah.”

Nixie tubes are the vacuum technology that manages to do far less than a graphic LCD while looking about a million times cooler. Generally speaking, these tubes are no longer manufactured, and the old stock you can get your hands on usually contain a set of filaments shaped like numbers. But @FriendlyWire’s tweet of this Nixie tube by [Dalibor Farny] breaks both of those rules. This handmade tube isn’t just a numerical display or a colon display (the punctuation mark, get your head out of the gutter). It’s a custom logo, and it’s beautiful.

Continue reading “Think IN18s Are Cool? Get A Load Of This Must-Have Custom Nixie Tube”

This CT Scan Of A PCB Is The Accidental ASMR We Didn’t Know We Needed

At risk of getting any ASMR buffs who might be reading cranky because there’s no audio, [Chris], or [@no1089] on Twitter, has gifted us with this visually stunning scan of his Maxim MAX86160 in-ear heart monitor mounted on a rigidflex PCB. You can take a look, in the video below the break.

If you’re wondering why anyone would scan a board, other than boredom, know that it’s actually quite common. X-Ray machines are commonly used as a quick, passive way to check a board that’s fresh off the production line. These aren’t the X-Rays like those of broken bones you’re (hopefully not too) used to seeing though, they’re Computed Tomography scans (CT scans, CAT scans), in effect just 3D X-Rays.

CT Scan of a BGA

For electronics manufacturers and assemblers, CT scans are incredibly useful because they provide a non-destructive way to check for errors. For example, how do you know if that middle BGA pin is actually soldered correctly? You could run a functional test and make sure everything is working (at least, everything you check), but that takes time. The longer it takes to validate, the higher the manufacturing cost. In manager speak: “cost bad. Fast good.”

It’s also common to use a CT scan to create a full 3D model of a board. This makes it easy to check every little detail, especially the ones that are visually obscured by surface mount devices or critical signal paths that are buried under board layers.

Highlight of solder joints on small-outline integrated circuit (SOIC) to a PCB’s pads.

If you want to geek out on CT scans, you can learn more about the lab that did this scan or by wading into this unclassified research paper from Australia’s Cyber and Electronic Warfare Division.

But we know you really want more of this video, but better. And we’ve got the goods. For the chill folk among you, here’s a 55-minute version without all the CT scan info cluttering the screen. For those of you currently blasting eDM in your headphones, here’s a 30 second clip of it looping at ~5x speed. Eat your heart out:

Continue reading “This CT Scan Of A PCB Is The Accidental ASMR We Didn’t Know We Needed”

Mind Poetry Mindflex Hack

Project Perceives Pondering, Prints Poetry

If poetry is your thing, this hack might convince you that your brain is more advanced than the rest of us poor sots. [Roni Brandini] designed a system that prints lines of poetry when you concentrate. The Mind Poetry project uses an EEG headset from Mattel’s Mindflex toy and pipes your brain’s signals to an Arduino Mega 2560. The system then looks for patterns of brain waves that indicate concentration. As you maintain your concentration, the system continues to print lines of poetry to a small display.

Tapping into the mindflex

[Roni] follows the standard Mindflex hack process by tapping into the data transmission pin on the Mindflex board. Optoisolation is provided by a PC817 to make sure wall power can’t accidentally bleed over into your own wetware. You could get away with just using batteries, but isolation is still a best practice.

The Arduino Brain Library is used to decipher the signal. The Mindflex picks up brain waves from roughly 1 Hz to 50 Hz, which is enough bandwidth to approximately determine mental state. For example, Theta waves are in the 4 Hz to 7 Hz range and can indicate a relaxed, meditative state. Low Beta waves range from 13 Hz to 17 Hz and indicate an alert, focused mental state. The Mindflex system is also generous in that it provides derived meditation and attention scores, ranging from 0 to 100.

It’s difficult to get a high level of precision with this sensor and sampling system, so the code uses [Roni]’s custom recipe of meditation score, attention score, and Low Beta value. He finds it most effective to trigger actions based on a relationship of these scores instead of focusing on the readings themselves. For example, an uptick in both Low Beta waves and the attention score indicate concentration.

Mindflex Brainwave Chart

If the wearer is concentrating, the system prints lines of poetry to the display and charts the three values. As an added gamification, it’ll tell you how many times you broke concentration before you completed the poem. One can imagine a game that tries to break concentration by printing other phrases or even activating an array of mechanical distractions.

If poetry isn’t your thing, you’re in luck. The “Mind Poetry” project also makes some headway (pun intended) with processing the EEG headset’s signals and triggering actions This means you don’t have to be into the poetry scene to reap the benefits. You now have the bones of a hack that lets you control things with your brain muscles and without your muscle muscles.

For inspiration, check out some other Mindflex hacks that let you order drinks with your mind (recommended), shock the heck out of people (not recommended), or even move around your skirt (uh… you do you?).

Continue reading “Project Perceives Pondering, Prints Poetry”

Universal music translation network

Hiding Data In Music Might Be The Key To Ditching Coffee Shop WiFi Passwords

In a move guaranteed to send audiophiles recoiling back into their sonically pristine caves, two doctoral students at ETH Zurich have come up with an interesting way to embed information into music. What sounds crazy about this is that they’re hiding data firmly in the audible spectrum from 9.8 kHz to 10 kHz. The question is, does it actually sound crazy? Not to our ears, playback remains surprisingly ok.

You can listen to a clip with and without the data on ETH’s site and see for yourself. As a brief example, here’s twelve seconds of the audio presenting two versions of the same clip. The first riff has no data, and the second riff has the encoded data.

You can probably convince yourself that there’s a difference, but it’s negligible. Even if we use a janky bandpass filter over the 8 kHz -10 kHz range to make the differences stand out, it’s not easy to differentiate what you’re hearing:

After many years of performing live music and dabbling in the recording studio, I’d describe the data-encoded clip as having a tinny feedback or a weird reverb effect. However, you wouldn’t notice this in a track playing on the grocery store’s speaker. Continue reading “Hiding Data In Music Might Be The Key To Ditching Coffee Shop WiFi Passwords”