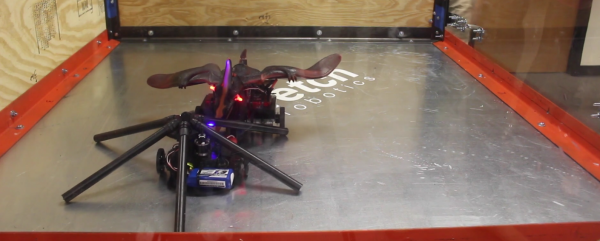
The folks at Fetch Robotics do love a good game of combat robots. Time is tight these days, however, so putting together a good ol’ 220-pounder for Robogames is a dream few of us can realize. Instead, the Fetch team hosted their own Plastic fantastic battlebots competition to blow off some steam, and the results are in!
Battlebots enter the ring built from a frame of entirely plastic parts and weighing a humble 3lbs. Just like Battlebots and Robogames, they’ll follow a 2-minute episode of hack-and-slash after which judges determine the winner. Bots were forged from everything you might see in arms reach of your local hackerspace: pvc pipe, acrylic sheets, and a few 3D-printed components. On the menu of shredded plastic we have everything from classic wedges and spinners to a giant spinning rubber pterodactyl strapped onto the body of an RC car. (Time is tight, right?)
While 3 pound plastic fighters might not seem devastating, don’t underestimate the LiPo batteries and brushless motors that are running under the hood. These competitors can easily heave each other across the ring. We’ve definitely seen mini Battlebot tournaments before, and we’re thrilled to see them on the rise in everyday places. Better start getting your materials ready. Who knows? Mini Battlebots might be coming to an alley near you too.
Continue reading “Plastic Battlebots Might Bite Your Hand Off”

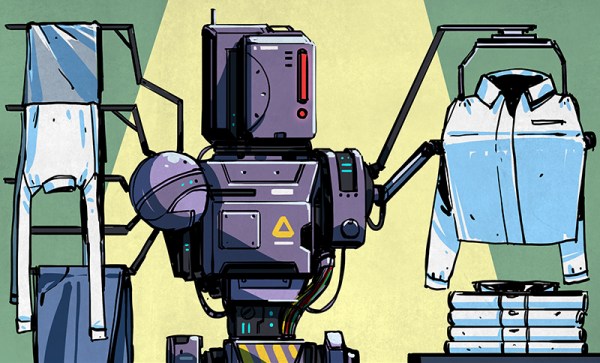
 “This is the year of the general purpose home robot!” “2016 is going to be for robots like 1976 was for the home computer!” The problem with statements like those is the fact that we’ve been hearing them since the 1970’s. General purpose home robots still have a long way to go. Sure, we’ve got Roomba, we’ve even got self-driving cars. But we don’t have Rosie from the Jetsons. And while I don’t think we’re going to get to Rosie for a while, there are some simple challenges that can spur development in that direction. One need look no further than one’s own laundry room.
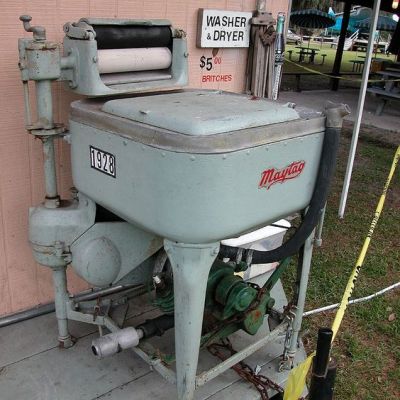 Using machines to wash and dry laundry isn’t a new concept. Washers and dryers have become commonplace enough that we don’t think of them as robots. Hamilton Smith patented the rotary washing machine in 1858. Maytag has had home machines available for nearly 100 years. Many of the early machines were powered by gasoline engines, as electricity wasn’t common in rural farmhouses. Things have improved quite a bit since then! From the dryer we transfer our laundry to a basket, where it has to be folded. It is this final step that cries out for a homemaking automaton to take this chore out of Everyman’s hands.