Serial Studio: Easily Visualise And Log Serial Data

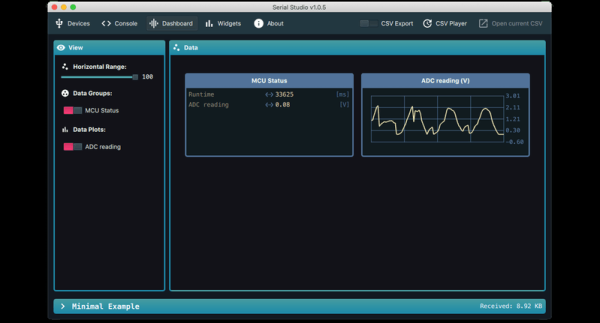
Outputting data from a microcontroller over a serial port is convenient and easy, but formatting, visualizing, and analyzing the data can be tedious and frustrating. [Alex Spataru] knows this all too well, having spent too many hours building and debugging custom dashboards. To save himself and others the same frustration in the future, he created Serial Studio, a tool for quickly building dashboards for serial data.

The only input required for Serial Studio to create a dashboard is a simple JSON structure specifying the data’s format, and how it should be grouped and displayed. Originally Serial Studio required all the JSON data to be sent over serial, which is fine for simple data but quickly becomes cumbersome for more complex applications. To solve this, [Alex] added a feature allowing the JSON document with the format information loaded from the computer, while only the data is sent over serial.

Serial Studio includes several visualization options, including raw line graphs, bar/level indicator, dial indicator, the artificial horizon for IMU data, or a map widget. It can also output the formatted data to a CSV file for further analysis in other software. A console window is also included for viewing raw data or debugging purposes. See the usage demo after the break.

We like Serial Studio’s ease of use and adaptability, and we’ll likely use it for our own projects in the future. It is compatible with Linux, Windows, and Mac thanks to the Qt framework, and the code is open-source and available on GitHub.

If you’ve ever watched one of the BPS.Space model rocket launch videos, you’ll know how critical data logging, visualization and analysis is for [Joe Barnard]’s work. Serial Studio is perfect for such applications, and [Alex] used it extensively for simulated satellite competitions at his university. Continue reading “Serial Studio: Easily Visualise And Log Serial Data”

The Seedy World Of Message Serialization

Look, I’ve been there too. First the project just prints debug information for a human in nice descriptive strings that are easy to understand. Then some tool needs to log a sensor value so the simple debug messages gain structure. Now your debug messages {{look like : this}}. This is great until a second sensor is added that uses floats instead of ints. Now there are sprinklings of even more magic characters between the curly braces. A couple days later and things are starting to look Turing complete. At some point you look up and realize, “I need a messaging serialization strategy”. Well you’ve come to the right place! Continue reading “The Seedy World Of Message Serialization”

Day Clock Monitors Air Quality Of The Great Indoors

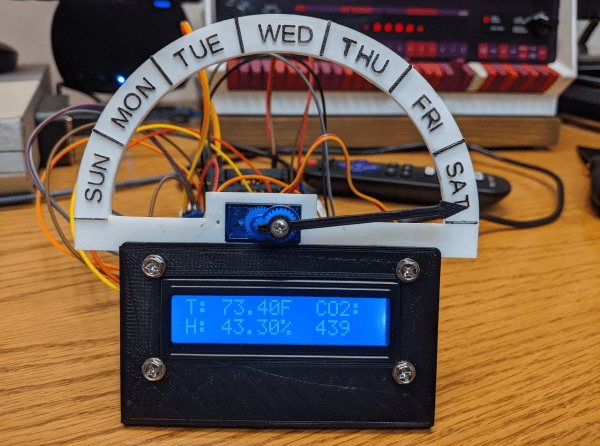
As the world settles into this pandemic, some things are still difficult to mentally reckon, such as the day of the week. We featured a printed day clock a few months ago that used a large pointer to provide this basic psyche-grounding information. In the years since then, [Jeff Thieleke] whipped up a feature-rich remix that adds indoor air quality readings and a lot more.

Like [phreakmonkey]’s original day tripper, an ESP32 takes care of figuring out what day it is and moves a 9 g servo accordingly. [Jeff] wanted a little more visual action, so the pointer moves a tad bit every hour. A temperature/humidity sensor and a separate CO₂ sensor output their readings to an LCD screen mounted under the pointer. Since [Jeff] is keeping this across the basement workshop from the bench, the data is also available from a web server running on the ESP32 via XML and JSON, and the day clock can get OTA updates.

Need a little more specificity than just eyeballing a pointer? Here’s a New Times clock that gives slightly more detail.

Stay Informed: How To Pull Your Own COVID-19 Data

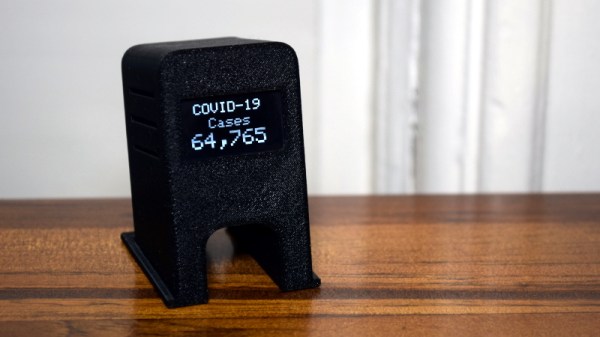
For all the technology we have, it can still be frustratingly difficult to get any concrete information from the media. Sometimes all you want to do is to cut through the noise and see some real numbers. Watching talking heads argue for a half hour probably isn’t going to tell you much about how the COVID-19 virus is spreading through your local community, but seeing real-time data pulled from multiple vetted sources might.

Having access to the raw data about COVID-19 cases, fatalities, and recoveries is, to put it mildly, eye-opening. Even if day to day life seems pretty much unchanged in your corner of the world, seeing the rate at which these numbers are climbing really puts the fight into perspective. You might be less inclined to go out for a leisurely stroll if you knew how many new cases had popped up in your neck of the woods during the last 24 hours.

But this article isn’t about telling you how to feel about the data, it’s about how you can get your hands on it. What you do with it after that is entirely up to you. Depending on where you live, the numbers you see might even make you feel a bit better. It’s information on your own terms, and in these uncertain times, that might be the best we can hope for.

Continue reading “Stay Informed: How To Pull Your Own COVID-19 Data”

MessagePack Is A More Efficient JSON

It is an age-old problem, that of having some data you want to store somewhere, and later bring it back. How do you format the data? Custom file formats are not that hard, but if you use an existing format you can probably steal code from a library to help you. Common choices include XML or the simpler JSON. However, neither of these are very concise. That’s where MessagePack comes in.

For example, consider this simple JSON stanza:

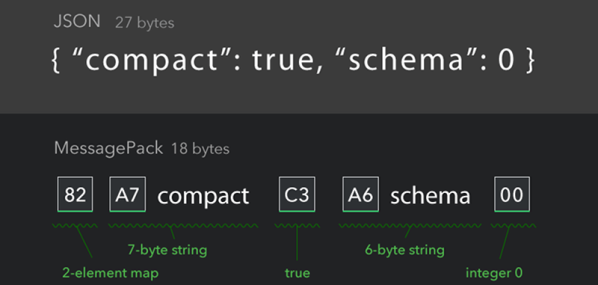
{"compact":true, "schema":0}

This is easy to understand and weighs in at 27 bytes. Using MessagePack, you’d signal some special binary fields by using bytes >80 hex. Here’s the same thing using the MessagePack format:

 
0x82 0xA7 c o m p a c t 0xC3 0xA6 s c h e m a 0x00

Of course, the spaces are there for readability; they would not be in the actual data stream which is now 18 bytes. The 0x82 indicates a two-byte map. The 0xA7 introduces a 7-byte string. The “true” part of the map is the 0xC3. Then there’s a six-byte string (0xA6). Finally, there’s a zero byte indicating a zero.

Continue reading “MessagePack Is A More Efficient JSON”

PrintEye Gives You Stats In A Blink

Once upon a time, most things were single-purpose, like the pocket watch. Then somebody made a watch with a date function, and next thing you know, we had TV/VCR combos and Swiss army knives. Now, people pull computers out of their pockets just to check the time or the bed temperature of their RepRap.

[Owen]’s antidote for this multi-function madness is PrintEye, a simple interface that queries his printer and displays its vital signs on a pair of OLED peepers. It’s a parts bin special, and you know how much we love those. PrintEye connects to the Duet controller over UART, and does its firmware whispering with an ATMega328P. The ‘Mega sends a single M-command and gets back all the status and temperature data in JSON format. Then it parses the info and displays it on twin OLED screens.

Want to make one? [Owen]’s got all the files you need over on IO, but offers no hand-holding services. If you’ve never spun a board before, this could be your introduction. Have to have an internet connection? Check out the Octoprint monitor that inspired PrintEye.

EVA: What’s On Telly For The Visually Impaired

[chewabledrapery] has certainly used his Raspberry Pi for good. His girlfriend’s grandfather is growing more visually impaired as time goes on. He likes to watch telly, but has trouble reading the on-screen information about the channel and programming. To that end, [chewabledrapery] has built an electronic voice assistant called EVA, who fetches the telly schedule from a web service and reads it aloud in her lovely voice that comes courtesy of Google Translate’s TTS function.

Under EVA’s hood is a Raspberry Pi. A USB hub powers the Pi and holds a small USB soundcard, a Wi-Fi dongle, and a USB daughterboard that the controller plugs into. The daughterboard is from a USB keyboard, which makes another appearance in the awesome controller. It’s made of a joystick and two arcade buttons that use the USB keyboard’s controller to interact with Python scripts.

[chewabledrapery]’s scripts make formatted requests to a web service called atlas, which returns JSON objects with the TV schedule and content descriptions. EVA then turns to Google Translate, speaking the formatted text through a small amplifier and salvaged PC speaker. In order to minimize the number of web calls, some of EVA’s frequent musings are stored locally. A full tour of EVA is after the break.

We love to see hacks that help people. Remember this RFID audio book reader?

Continue reading “EVA: What’s On Telly For The Visually Impaired”