A continuity tester, as found on most multimeters today, is a great tool for finding broken connections and short circuits. But once you’ve found a short, it’s up to you to figure out which part of the circuit it’s in – a tedious job on a large PCB with hundreds of components. [John Guy] aims to ease this task with a continuity tester that modulates the beeper’s tone according to the resistance measured in the circuit. Tracking down a short circuit is then simply a matter of probing multiple points along a track and observing whether the pitch goes up or down.
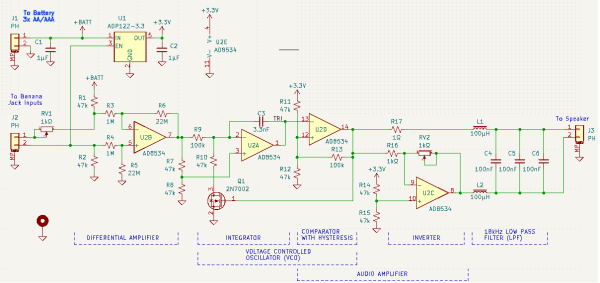
 The circuit is based on a single AD8534 quad op amp chip. The first stage measures the voltage across the circuit under test in response to small current and amplifies it. The resulting signal is fed into a voltage-controlled oscillator (VCO) made from one op amp connected as an integrator and another working as a comparator with hysteresis. Op amp number four amplifies the resulting square wave and drives a speaker. A low-pass filter makes the sound a bit more pleasing to the ears by removing the higher notes.
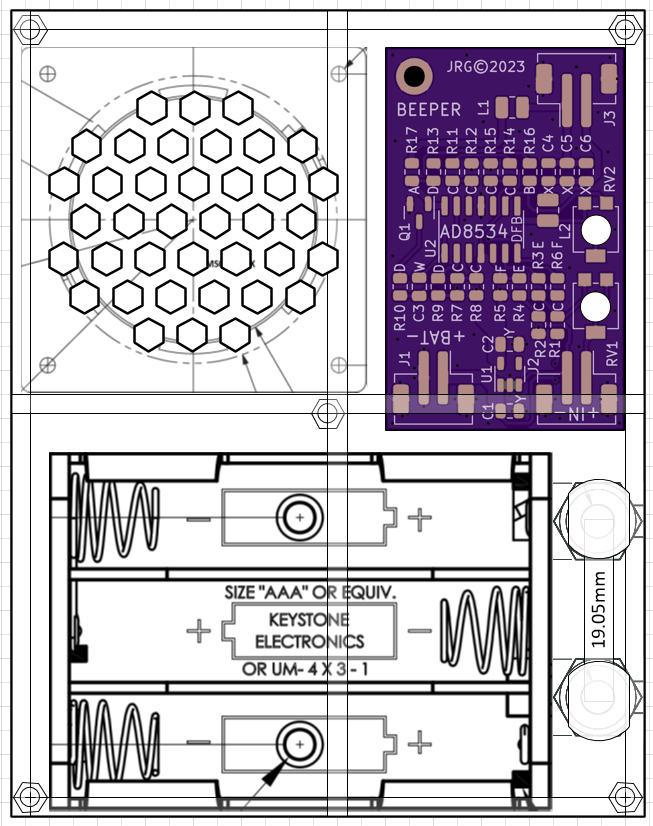
[John] paid particular attention to the PCB design to make it easy to assemble despite having a large number of SMD components on a small board. He even placed a parts list on the rear silkscreen, so anyone can assemble it even without the accompanying documents. The resulting board can be placed in a laser-cut acrylic case, turning it into a neat handheld instrument that will definitely find a place in any engineer’s toolbox. Measuring resistance through sound is not as accurate as using a full four-wire setup with an ohmmeter, but will be much faster and easier if you just want to find that annoying solder bridge hiding somewhere on your board.


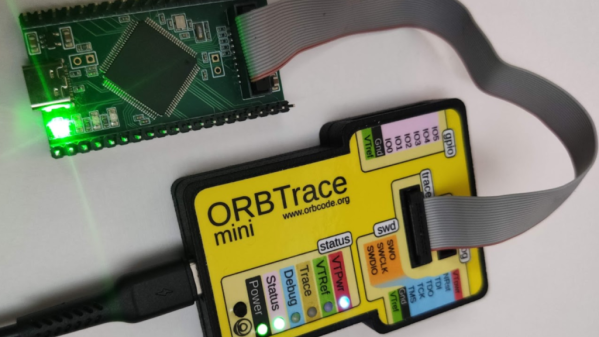
 The ORBTrace platform has plenty of untapped potential. There’s