Fresh from ETH Zurich comes the new Silq programming language. They also have submitted a paper to the PLDI 2020 conference on why they feel that it is the best quantum programming language so far. Although it may be not common knowledge, the lack of usable general purpose quantum computers has not kept multiple teams from developing programming languages for such computer systems.
Microsoft’s Q# is a strong contender in this space, along with the older QCL language. The claims by the Silq team on exactly why their language is better appear to come down to it being ‘more high level’, and by supporting automatic (and safe) uncomputation. While the ‘high level’ aspect is suspect since Q# is most decidedly a high-level programming language, their uncomputation claim does at least have some merit.
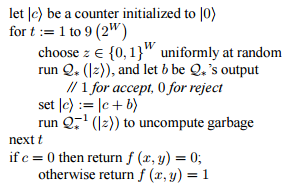
Uncomputation is a concept in quantum programming, where one occasionally has to remove a few intermediate objects from the current state because they may cause quantum interference that would affect the resulting output. Normally, one would save the intermediate result to a register for this, then reset the state and continue. Which parts of the state to keep and what to uncompute is however not easily determined, as a quick glance at related answers over at the Quantum Computing StackExchange and Theoretical Computer Science might reveal.
The main question thus appears the validity of this claim about Silq being able to automatically determine what ‘garbage’ can be safely uncomputed, and what should be part of the quantum interference. We have all seen with languages like Java and C# how even with traditional computing something as simple as garbage collecting can go horribly wrong. Maybe we shouldn’t count our quantum chickens yet until this particular waveform has fully collapsed.
(Thanks to Qes)