In the auto world, there are lots of overarching standards that all automakers comply with. There are also lots of proprietary technologies that each automaker creates and uses for its own benefit. [Shehriyar Qureshi] has recently been diving into Suzuki’s Serial Data Line standard, and has created a digital dash using the data gained.
The project started with Python-based scanner code designed to decode Suzuki’s SDL protocol. Armed with the ability to read the protocol, [Shehriyar] wanted to be able to do so without having to haul a laptop around in the car. Thus, the project was ported to Rust, or “oxidized” if you will.
In today’s high-speed information overload environment, we often find ourselves with too much data to take in at once, causing us to occasionally miss out on opportunities otherwise drowned out in noise. None of this is more evident in the realm of high-speed trading, whether it’s for stocks, commodities, or even crypto. Most of us won’t be able to build dedicated high speed connections directly to stock exchanges for that extra bit of edge over the other traders, but what we can do is build a system that keys us in to our cryptocurrency price of choice so we know exactly when to pull the trigger on a purchase or sale.
[rishab]’s project for doing this is based on an ESP32 paired with a 10″ touchscreen display. It gathers live data from Binance, a large cryptocurrency exchange that maintains various pieces of information about many digital currencies. [rishab]’s tool offers a quick, in-depth look at a custom array of coins, with data such as percentage change over a certain time and high and low values for that coin as well. The chart updates in real time, and [rishab] also built a feature in which scales coins up if they have been seeing large movements in price over short timeframes.
Although it’s not a direct fiber link into an exchange, it certainly has its advantages over keeping this information in a browser window on a computer where it could get missed, and since it’s dedicated hardware running custom firmware it can show you exactly what you need to see if you’re day trading crypto. Certainly projects like this are in the DIY spirit that crypto enthusiasts tout as ideals of the currency, and as people move away from mining and more into speculative trading we’d expect to see more projects like this.
In the rush to always have the latest and greatest, it’s not uncommon that perfectly serviceable hardware ends up collecting dust in a drawer somewhere. If you’ve got an old Kindle laying around, you may be interested in this write-up from [Hemant] that shows a practical example of how the popular e-reader can be pushed into service as a weather dashboard.
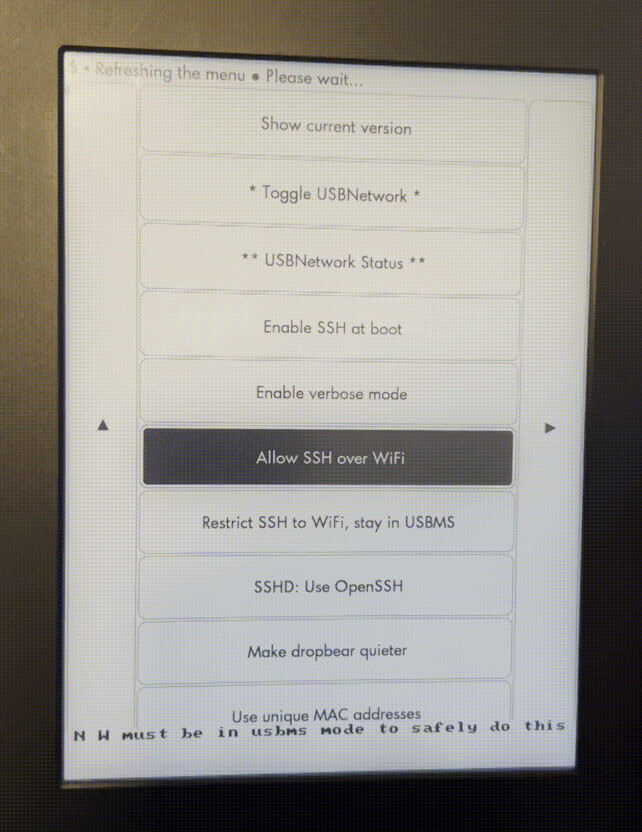
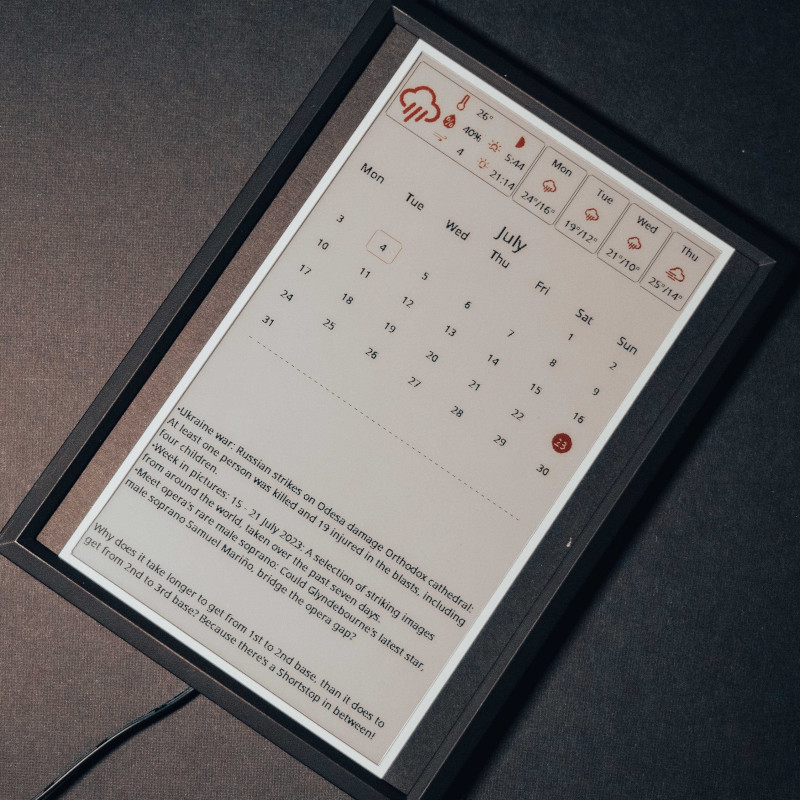
The first step is to jailbreak the Kindle, providing the user with root access to the device. From there the Kindle Unified Application Launcher (KUAL) is installed along with USBNetwork which allows you to connect to the reader over SSH. With root access and a network connection, the real project of converting it to a weather dashboard begins. [Hemant] split the project into two parts here, a Node.js server that scrapes weather data from the internet and converts it into an image, and a client for the Kindle that receives this image for display.
The Kindle has a number of quirks and issues that [Hemant] covers as well, including handling image ghosting on the e-ink display as well as a problem where the device will hang if the Internet connection is lost. For those with jailbroken Kindles that want to put their devices back into useful service, this is an excellent guide for getting started and [Hemant] also provided all of the source code on the project’s GitHub page.
The e-paper “dashboard” is something we’ve seen plenty of times here at Hackaday. Use it to show your daily schedule, the news, weather, maybe the latest posts from your favorite hardware hacking website. Any information source that doesn’t need to be updated more than every hour or so is a perfect candidate. All you’ve got to do is write the necessary code to pull down said data and turn it into a visually attractive display.
Well, that last part isn’t always so easy. There are plenty of folks who have no problem cobbling together a Raspberry Pi and one of the commercially available e-paper modules, but writing the software to turn it into a useful information center is another story entirely. Luckily, Inkycal is here to help.
This open source project uses Python to pull information from a wide variety of sources and turns it into an e-paper friendly dashboard. It works with Waveshare displays ranging from 4.2 inches all the way up to the massive 12 inch tricolor panels. While it could theoretically be deployed on any operating system running a modern version of Python, it’s primarily developed to be run under Linux and on the Raspberry Pi. All of the versions of the Pi are supported, so no need to spring for the latest and greatest model. In fact, the notoriously pokey Raspberry Pi Zero is their recommended platform thanks to its low power consumption.
With Inkycal on the Pi — they even provide a pre-configured SD card image — and the e-paper display hooked up, all you need to do is pick which sources you want to use from the web-based configuration page. Look ma, no code!
[BuyItFixIt] is well known as a dab hand at, well, fixing things… and presumably buying them, too. Recently, they received an email calling for help of the former kind. One of their Australian viewers owned the same model of tractor, but with a dead digital dash. Thankfully, help was at hand!
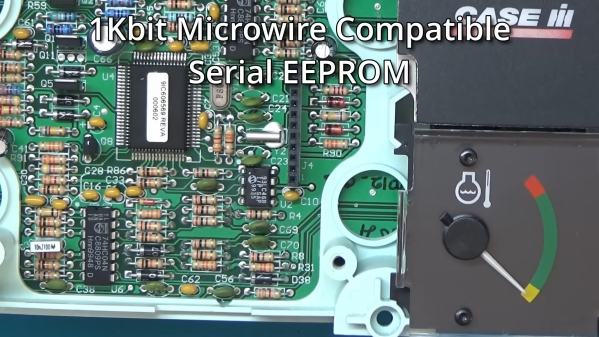
The problem turned out to be due to a dead EEPROM on the Australian tractor. In contrast, [BuyItFixIt] had a perfectly working dashboard on their tractor. Thus, they set about disassembling the dash and dumping the EEPROM to try and sort the stricken farm implement. This posed some risk of ending up with two dead dashboards, necessitating a careful hand. In any case, the Case tractor had a fairly simple dash with a majority of through-hole components, making it fairly easy to work with. The Microchip 93LC46B chip was in a DIP package, and was removed with the aid of some low-melting point solder in short order. The contents of the EEPROM were then dumped to a file using a XGecu T48 programmer.
With the file sent off via email, the Australian tractor owner flashed a fresh EEPROM and reinstalled it in their cluster. They were greeted with success, with the only complication being that the hours reading on the cluster had to be corrected to match the previous reading on their machine.
It’s a fairly simple story of fixing an embedded system, but it’s an educational one. It also comes with a deeper dive into how the CASE dashboard works. Just about anyone with basic electronic skills could pull this off and save an entire tractor in the process. It’s great to see these jobs documented so that we can all learn useful basic skills like these. Video after the break.
One of the biggest upsides of open communications standards such as CAN or SPI is that a whole world of vehicle hacking becomes available, from simple projects like adding sensors or computers to a car or even building a complete engine control unit from the ground up. The reverse is true as well; sensors and gauges using one of these protocols can be removed from a car and put to work in other projects. That’s the idea that [John] had when he set about using a vehicle’s dashboard as a information cluster for his home.
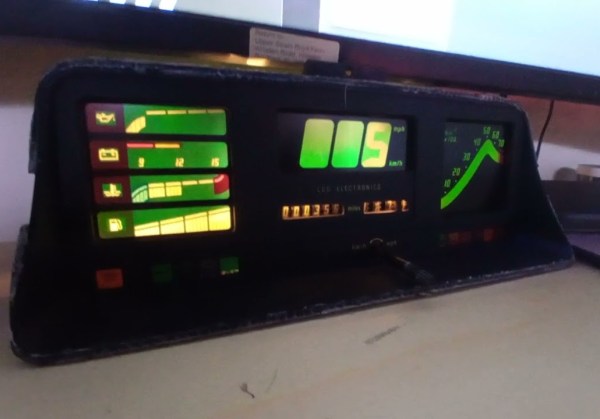
The core of the build is an Astra GTE dashboard cluster, removed from its host vehicle, and wired to an Arduino-compatible board, in this case an ESP32. The code that [John] wrote bit-bangs an SPI bus and after some probing is able to address all of the instrument gauges on the dashboard. For his own use at home, he’s also configured it to work with Home Assistant, where each of the gauges is configured to represent something his home automation system is monitoring using a bit mask to send data to specific dials.
While this specific gauge cluster has a lot of vehicle-specific instrumentation and needs a legend or good memory to tie into a home automation system without any other modification, plenty of vehicle gauges are more intuitive and as long as they have SPI they’d be perfect targets for builds that use this underlying software. This project takes a similar tack and repurposes a few analog voltmeters for home automation, adding a paper background to the meters to make them easier to read.
Ford is looking to make their new Maverick compact truck stand out, and so far, it seems to be working. Not only is it exceptionally cheap for a brand-new hybrid, truck or otherwise, but Ford actively encourages owners to modify their new ride. From standardized mounting points throughout the cabin intended for 3D printed upgrades, to an auxiliary 12 VDC line run to the bed specifically for powering user supplied hardware.
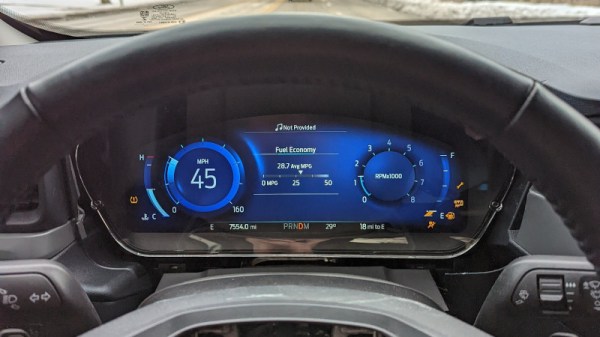
But we doubt even the most imaginative of Blue Oval engineers could have predicted that somebody would rip out the whole dash module and replace it with one from a higher-end Ford this early in the game. While many people can’t even find one of these trucks on the lot, [Tyvemattis] on the Maverick Truck Club forum has detailed his efforts to replace the relatively uninspired stock dash module of his truck with an all-digital version pulled from a 2020 Ford Escape Titanium.
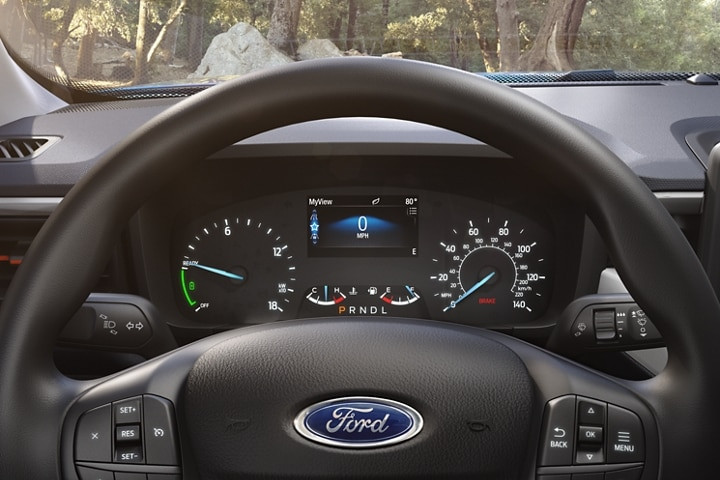
Ford’s rendering of the original Maverick dash module.
Now we say “effort”, but as it turns out, the swap went off nearly without a hitch. The new digital module not only appears to be the identical size and shape as the original, but they both use the same connectors. Presumably this is because both vehicles are based on Ford’s scalable C2 platform, and likely means more components from this family of vehicles such as the Lincoln Corsair or new Bronco could be installed into the Maverick.
So what’s the downside? According to [Tyvemattis], the computer is throwing error messages as the Maverick doesn’t have a lot of the hardware that the dash is trying to communicate with. He also can’t change the vehicle’s driving mode, and the cruise control can only be enabled when the truck is stopped. But probably the most annoying issue is that the fuel gauge is off by 50%, so when the tank is full, it shows you’ve only got half a tank. At least one other user on the forum believes this could be alleviated by modifying the fuel sensor wiring, so it will be interesting to see how difficult a fix it ends up being.