Fusion For STM32: Development Board With Debugging And Programming Via WiFi

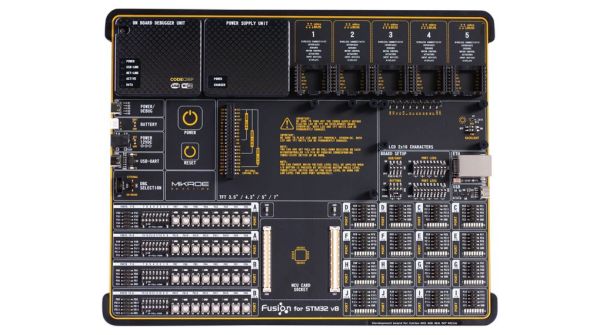
Clearly profiling itself as the Lamborghini or Ferrari of the STM32 development board world, MikroElektronika’s current (8th) revision of their Fusion development board was released last year with support for not only flashing but also debugging the attached STM32 MCU via the onboard WiFi module. The Serbian company’s pricing for the bare board without MCU modules or any other peripherals appears to be around 300 USD/Euro. Additional MCU boards cost between $28 – $60 each.

As the official product page explains, the board is combined with the CodeGrip software to manage the board either via USB-C (driver-free) – which also allows one to configure the WiFi option – and via WiFi. Peripheral boards are added via the 5 onboard MikroBUS expansion slots, either with existing boards, or custom MikroBUS boards. The power supply is also onboard, powered via USB, a barrel jack connector, or an external battery.

The use of WiFi to connect to the board would allow for it to be easily managed and debugged when it’s in a less convenient location than one’s desk, which would seem like a major boon.

Obviously it’s not a cheap board, and the MCU cards each cost about as much as a Nucleo or Discovery board from ST would cost, making it hard to justify purchasing it for anything but a professional environment. However, the tantalizing thing here is probably that so much of the design details are available, from the expansion bus to the pin-out and schematic of the MCU cards (STM32F767ZG version).

The MCU cards use the Hirose FX10A-168S-SV and FX10A-168P-SV(71) connectors, all readily available. This opens the possibility of developing compatible MCU cards. An MCU card template project can for example be found here.

Peeking Inside Executables And Libraries To Make Debugging Easier

At first glance, both the executables that a compiler produces, and the libraries that are used during the building process seem like they’re not very accessible. They are these black boxes that make an application go, or make the linker happy when you hand it the ‘right’ library file. There is also a lot to be said for not digging too deeply into either, as normally things will Just Work™ without having to bother with such additional details.

The thing is that both executables and libraries contain a lot of information that normally is just used by the OS, toolchain, debuggers and similar tools. Whether these files are in Windows PE format, old-school Linux a.out or modern-day .elf, when things go south during development, sometimes one has to break out the right tools to inspect them in order to make sense of what is happening.

This article will focus primarily on the Linux platform, though most of it also applies to BSD and MacOS, and to some extent Windows.

Continue reading “Peeking Inside Executables And Libraries To Make Debugging Easier”

Using Valgrind To Analyze Code For Bottlenecks Makes Faster, Less Power-Hungry Programs

What is the right time to optimize code? This is a very good question, which usually comes down to two answers. The first answer is to have a good design for the code to begin with, because ‘optimization’ does not mean ‘fixing bad design decisions’. The second answer is that it should happen after the application has been sufficiently debugged and its developers are at risk of getting bored.

There should also be a goal for the optimization, based on what makes sense for the application. Does it need to process data faster? Should it send less data over the network or to disk? Shouldn’t one really have a look at that memory usage? And just what is going on inside those CPU caches that makes performance sometimes drop off a cliff on a single core?

All of this and more can be analyzed using tools from the Valgrind suite, including Cachegrind, Callgrind, DHAT and Massif.

Keeping Those Cores Cool

Modern day processors are designed with low power usage in mind, regardless of whether they are aimed at servers, desktop systems or embedded applications. This essentially means that they are in a low power state when not doing any work (idle loop), with some CPUs and microcontrollers turning off power to parts of the chip which are not being used. Consequently, the more the processor has to do, the more power it will use and the hotter it will get.

Continue reading “Using Valgrind To Analyze Code For Bottlenecks Makes Faster, Less Power-Hungry Programs”

Original Zork MDL Source Code Has Been Released

Though mostly known for its releases on countless 8-bit personal computers from the 1970s and 1980s, the game of Zork began its life on a PDP-10 mainframe. Recently, MIT released the original source code for this version of Zork. As we covered a while ago, the history of Zork is a long and lustrous one, a history that is based on this initial version written in MDL.

To recap, MDL is a LISP-derived language that excels at natural language processing. It was developed and used at MIT’s AI and LCS (now CSAIL) departments for a number of projects, and of course to develop games with. The use of MDL gave Zork as a text-based adventure a level of interaction that was far ahead of its time.

What MIT has made available is the source code from Zork as it existed around 1977, at a time when it was being distributed to universities around the US. For purely educational purposes, obviously. This means that it’s a version of Zork before it was commercialized (~1979), showing a rare glimpse of the game as it was still busily being expanded.

Running the game will take a bit of effort, however. These files were retrieved from an original MIT backup tape that was used with their PDP-10 machines. Ideally one would use a 1970s-era PDP-10 mainframe with an MDL compiler, but in a pinch one could run a PDP-10 emulator as well.

Let us know whether you got it to run. Screenshots (ASCII or not) are highly encouraged.

Using Smartphone Cameras To Make Sure Drivers Are Looking At The Road

Most of us are probably quite aware of the damage that a car can inflict when driven by a distracted driver. In an ideal world, people who are driving a car would not allow something like their phone to distract them from their primary task of being the primary navigation system for the 1+ metric ton vehicle which they are controlling.

Many smartphone apps as well as in-car infotainment systems have added features over the years that try to prevent a driver from using them, but they run into the issue that it’s hard to distinguish between passenger and driver. As it turns out, asking the human driver whether they are the driver doesn’t always get the expected result. This is where [Rushil Khurana] and his team at Carnegie Mellon University (CMU) have come up with a more fool-proof approach.

In their paper (PDF), they cover the algorithm and software implementation that uses the smartphone’s own front (selfie) and back cameras to determine from the car’s interior which side of the car the user is sitting in, and deducing from that whether the user is sitting in the driver’s seat or not.  From there it is a fairly safe assumption to make that if the user is sitting in the driver’s seat, and the car is moving, that this user should not be looking at the phone’s screen.

In a test involving 16 different cars and 33 users, they achieved an overall accuracy of 94% with the phone held in the hand, and 92.2% while docked. This is more reliable than the other approaches covered in the paper, and as a benefit does not require any extra hardware. Who knows, upcoming smartphones may include a feature like this, so that apps can easily determine what feature set should be made available to a driver, if any.

Continue reading “Using Smartphone Cameras To Make Sure Drivers Are Looking At The Road”

Giving Surfaces Their Own Antiviral Coating To Fight Infection

The use of disinfectants is not a new thing, but a major disadvantage with most common disinfectants is that they are only effective in the short term. After applying bleach, alcohol or other disinfectant to the surface, the disinfectant’s effect quickly fades as the liquid evaporates. Ideally the disinfectant would remain on the surface, ready to disinfect when needed.

According to researchers at the Hong Kong University of Science and Technology (HKUST), the solution may lie in a heat-sensitive coating that releases disinfectant when it’s needed. This Multilevel Antimicrobial Polymer (MAP-1) can remain effective for as long as 90 days, depending on how often the surface is touched or otherwise used.

MAP-1 consists out of polymer strands of a material that prevents viruses and bacteria from attaching to its surface, while disrupting its outside surface. Effectively this has the potential to inactivate (kill) most viruses and harmful bacteria that come into contact with it.

MAP-1 is currently being deployed in Hong Kong, where public places such as schools, malls and sport facilities have had the coating applied. It costs between US $2,600 and US $50,000 to treat an area, which is not cheap, but would be cheaper than shutting down such a facility for regular surface disinfecting.

Although it still has to be determined that MAP-1 is as effective as hoped, it is another example of an antimicrobial surface, a material that is designed to be as incompatible with sustaining viruses and bacteria as possible. In the past copper and its alloys have been commonly used for this purpose, but a polymer coating is obviously more versatile. From the point of view of today’s pandemic, making surfaces incapable of hosting viruses definitely can be regarded as highly necessary.

(Pictured: a MAP-1 coating on a surface, courtesy of HKUST)

Using Valgrind To Track Down Known And Unknown Bugs In Your Code

We all know what bugs in code are. We don’t like them when they are in programs we use, and they’re even worse when they are in code which we have written. Clearly, the best code is bug-free, but how do we get there?

This isn’t a new question, of course, just one that has become ever more important as the total number of lines of code (LoC) that run modern day society keeps increasing and which is affecting even hobbyists more and more often now that everything has a microcontroller inside.

Although many of us know the smug satisfaction of watching a full row of green result markers light up across the board after running the unit tests for a project, the painful reality is that you don’t know whether the code really is functionally correct until it runs in an environment that is akin to the production environment.  Yet how can one test an application in this situation?

This is where tools like those contained in the Valgrind suite come into play, allowing us to profile, analyze and otherwise nitpick every single opcode and memory read or write. Let’s take a look, shall we?

Continue reading “Using Valgrind To Track Down Known And Unknown Bugs In Your Code”