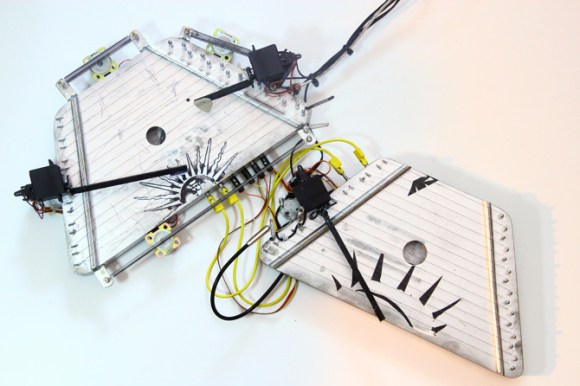
Self-playing pianos are so last year. How about a robotic acoustic-gusli?
[Dmitry Morozov] calls it the Turbo-Gusli or Gusli-Samogudy. A Gusli is perhaps the oldest Russian multi-stringed instrument, which resembles a harp and whose exact history is not quite known. Add Samogudy to the name and you’ve got a “self-playing Gusli”.
The eerie sounding music is produced by six individual servo motors, a regular DC motor, a stepper motor, three solenoids, a handful of springs, and 38 strings. It’s all controlled by two Arduino Unos, with the software written in Pure Data, an open source visual programming language.
He’s made several videos of the exhibit, including a performance that sends shivers down our spines — stick around after the break for a listen!
Continue reading “Eerie Robotic Instruments Make Use Of Servos And Solenoids”