Keeping tabs on the night sky is an enjoyable way to stay connected to the stars, and astronomy can be accessible to most people with a low entry point for DIY telescopes. For those who live in areas with too much light pollution, though, cost is not the only issue facing amateur astronomers. Luckily there are more ways to observe the night sky, like with this open source software package from [elanorlutz] which keeps tabs on all known asteroids.
The software is largely based on Python and uses a number of databases from NASA to allow anyone with a computer to explore various maps of the solar system and the planetary and non-planetary bodies within it. Various trajectories can be calculated, and paths of other solar system bodies can be shown with respect to an observer in various locations. Once the calculations are made in Python it is able to export the images for use in whichever image manipulation software you prefer.
For several years now we’ve been following [Jay Bowles] as he brings high-voltage down to Earth on his Plasma Channel YouTube channel. From spark gaps made of bits of copper pipe to automotive ignition coils driven by the stalwart 555 timer, he’s got a real knack for keeping his builds affordable and approachable. But once in a while you’ve got to step out of your comfort zone, and although the dedicated DIY’er could still replicate the solid state “pancake” Tesla coil he documents in his latest video, we’d say this one is better left for the professionals.
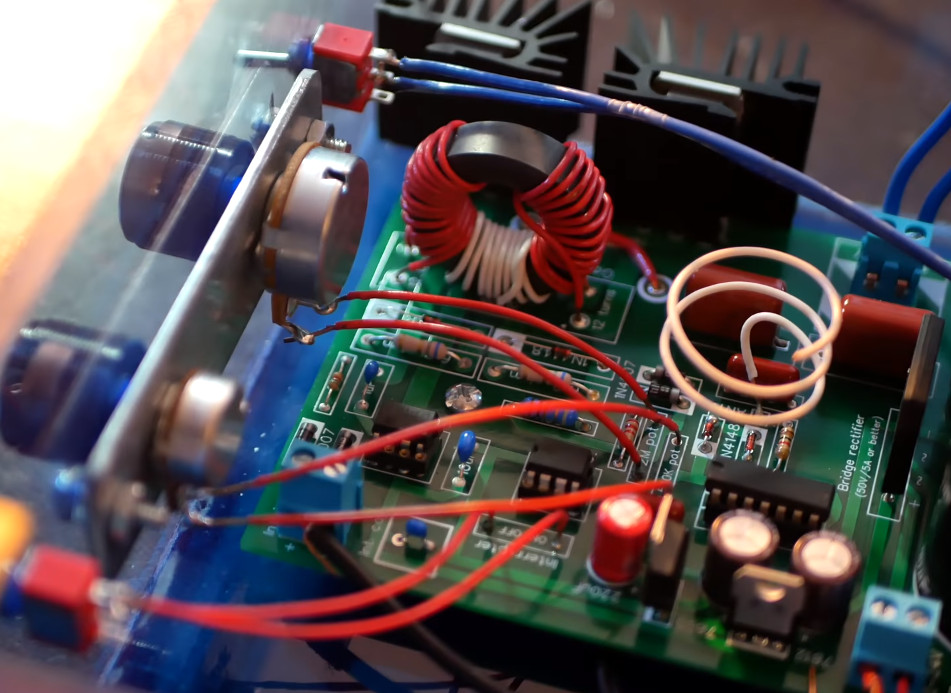
The story starts about nine months ago, when [Jay] was approached by fellow YouTuber [LabCoatz] to collaborate on a PCB design for a solid state Tesla coil (SSTC). Rather than a traditional spark gap, a SSTC uses insulated-gate bipolar transistors (IGBTs) triggered by an oscillator, which is not only more efficient but allows for fine control of the primary coil. The idea was to develop an AC-powered coil that was compact, easy to repair, and could be controlled with just a couple dials on the front panel. The device would also make use of an antenna feedback system that would pick up the resonant frequency of the secondary coil and automatically adjust the IGBT drive to match.
Being considerably more complex than many of the previous builds featured on Plasma Channel, it took some time to work out all the kinks. In fact, the majority of the video is [Jay] walking the viewer through the various failure modes that he ran into while developing the SSTC. Even for somebody with his experience in high-voltage, there were a number of headscratchers that had to be solved.
For example, the first version of the design used metal bolts to attach the primary and secondary coils, until he realized that was leading to capacitive coupling and replaced them with acrylic blocks instead. If his previous videos surprised you by showing how easy it could be to experiment with high-voltages, this one is a reminder that it’s not always so simple.
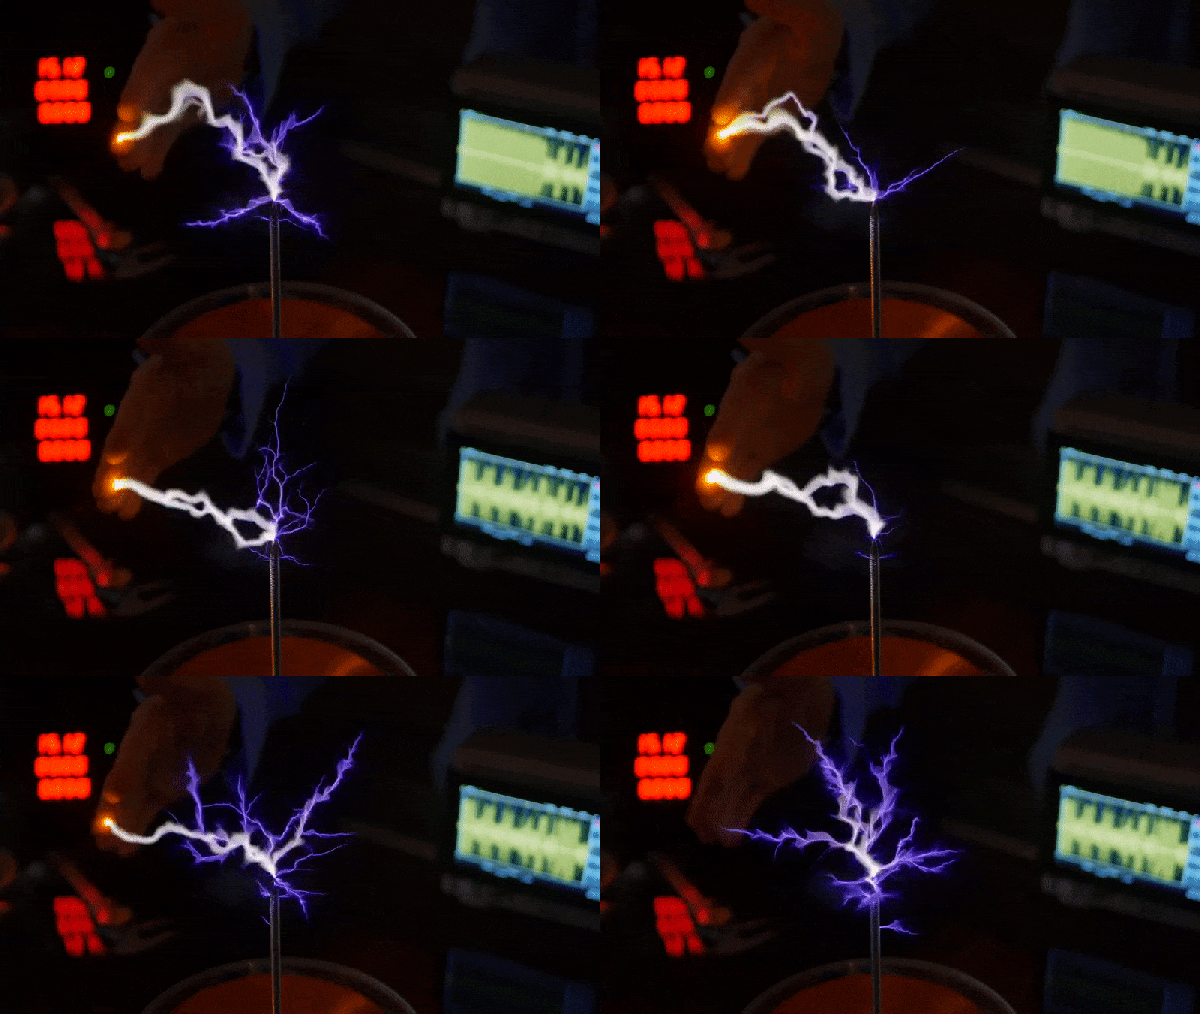
But in the end [Jay] does get everything sorted out, and the results are nothing short of spectacular. Even on the lower power levels it throws some impressive sparks, but when cranked up to max, it offers some of the most impressive visuals we’ve seen so far from Plasma Channel. It was a lot of work, but it certainly wasn’t wasted effort.
Scientists estimate that approximately 900 species have gone extinct in the last five centuries alone, to say nothing of the thousands or millions that vanished from life in the billions of years before that.
Do you have anything radioactive in your house? Most people will say no, but they are probably wrong. A host of things ranging from glow-in-the dark timepieces to smoke detectors have some amount of radioactivity. But as [Wheeler Scientific] points out, so do some old Scotch tape dispensers. You can watch the video, below.
The dispenser in question is the C-15 which was very common around offices, military bases, and homes for years. They were made up until the 1980s. You have to wonder why a tape dispenser would be radioactive, and [Wheeler] has the explanation.
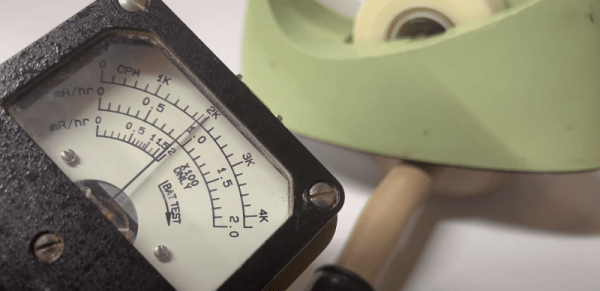
When you pull tape from the dispenser, you don’t want the dispenser to slide around the desk, so it needs to be heavy. But no one wants to have a giant dispenser nor do you want to pay for one made from a dense metal. So the plastic dispenser contains a ballast to make it heavier. In the case of the C-15 that ballast is thorium-containing monazite sand. A vintage counter shows the radioactivity which isn’t much, of course, but still way less than the ordinary sand used in newer models. You can also see in the video that the material is paramagnetic.
Monazite used to be a primary source of lanthanides but getting rid of the thorium led to alternate sources in the 1960s although it is still used as an ore for thorium. We know some lenses are radioactive. If you want to search your home for radioactivity and you don’t have a Geiger counter, you don’t need much to build one.
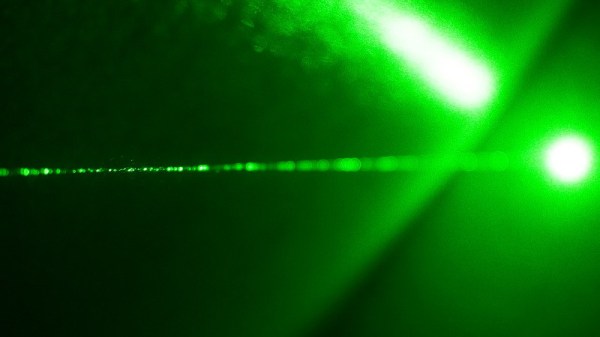
Every high school physics student knows c, or the speed of light, it’s 3 x 10^8 metres per second. More advanced or more curious students will know that this is an approximation, and the figure of 299,792,458 metres per second that forms the officially accepted figure comes from a resonance of the caesium atom from which is derived a value for the second.
Galileo Galilei, whose presence in this story should come as no surprise. Justus Sustermans, Public domain.
But for those who are really curious about measuring the speed of light the question remains: Just how did we arrive at that figure and how long have we been measuring it? The answer contains some surprises, and some exceptionally clever scientific thought and experimentation over the centuries.
The nature of light and whether it had a speed at all had been puzzling philosophers and scientists since antiquity, but the first experiments performed in an attempt to measure it were you will not be surprised to hear, performed by Galileo sometime in the early 17th century. His experiment involved his observation of assistants uncovering lanterns at known distances away, and his observations failed to arrive at a figure.
Later that century in 1676 the first numerical estimate of the speed of light was made by the Danish astronomer Ole Rømer, who observed an apparent variation in the period of one of Jupiter’s moons depending upon whether the Earth was approaching it or moving away from it. From this he was able to estimate the time taken for light to cross the Earth’s orbit, and from there the mathematician Christiaan Huygens was able to produce a figure of 220,000,000 metres per second.
Spinning Cogs And Mirrors: Time Of Flight
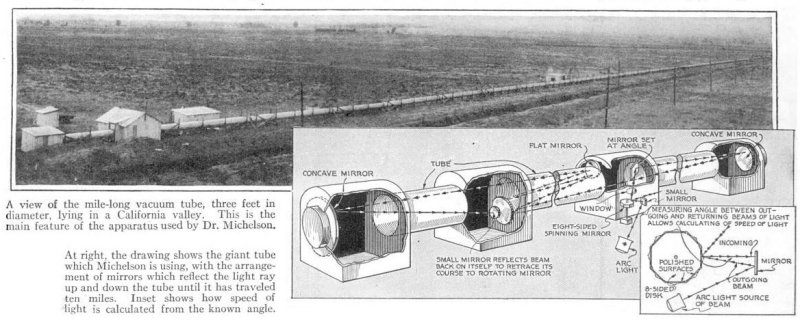
The mile-long evacuated tube used in Michelson’s time-of-flight experiment. H. H. Dunn, Public domain.
The experiments with which we will perhaps be the most familiar are the so-called time of flight measurements, which take Galileo’s idea of observing the delay as light travels over a distance, and bring to it ever higher precision. This was first performed in the middle of the 19th century by the French physicist Hippolyte Fizeau, who reflected a beam of light from a mirror over several kilometres, and used a toothed wheel to chop it into pulses. The pulses could be increased in frequency by moving the wheel faster until the time taken for the light to travel the distance from wheel to mirror and back again matched the separation between teeth and the returning pulse could be observed. His calculation of 313,300,000 metres per second was successively improved upon through the work of succession of others including Léon Foucault, culminating in the series of experiments by the American physicist Albert A. Michelson in the 1920s. Michelson’s final figure stood at 299,774,000 metres per second, measured through a multi-path traversal of a mile-long evacuated tube in the California desert. In the second half of the century the techniques shifted to laser interferometry, and in the quest to define the SI units in terms of constants, eventually to the definition mentioned in the first paragraph.
The most fascinating part of the story probably encapsulates the essence of scientific discovery, namely that while to arrive at something takes the work of many scientists building on the work of each other, it can then often be rendered into a form that can be understood by a student who hasn’t had to pass through all that effort. We could replicate Fizeau and Michelson’s experiments with a pulse generator, laser diode, and oscilloscope, which while of little scientific value nearly a century after Michelson’s evacuated tube, is still immensely cool. Has anyone out there given it a try?
Traditionally, when it comes to high-tech self-assembling microscopic structures for use in medicine delivery, and refined, delicate grippers for robotics, there’s been a dearth of effective, economical options. While some options exist, they are rarely as effective as desired, with microscopic medicine delivery mechanisms, for example, not having the optimal porosity. Similarly, in so-called soft robotics, many compromises had to be made.
A promising technology here involves the manipulation of flat structures in a way that enables them to either auto-assemble into 3D structures, or to non-destructively transform into 3D structures with specific features such as grippers that might be useful in both micro- and macroscopic applications, including robotics.
Perhaps the most interesting part is how much of these technologies borrow from the Japanese art of origami, and the related kirigami.
In the 1990 movie The Hunt For Red October, a stealth submarine is located by what a computer thinks are seismic sounds, but when sped up, they are clearly mechanical. We won’t spoil it further on the off chance that you haven’t seen. We can’t help but wonder if [Prof. Jeff Moore] and his team at the University of Utah were inspired by the movie. Why so? Because they have taken the seismic vibrations of the beautiful arches in Utah, US and sped them up 25 times, placing them right in the range of human hearing on their Red Rock Tones website. Go have a quick listen. We’ll be right here.
The resulting sound bites are just beautiful, and some of them have an almost eerie underwater tone to them as if driven along by a clandestine propulsion system. But that might just be our imagination running away a bit. That’s likely the point of this scientific exercise, however- taking raw scientific data and making it accessible and somehow relevant to even non-geologists.
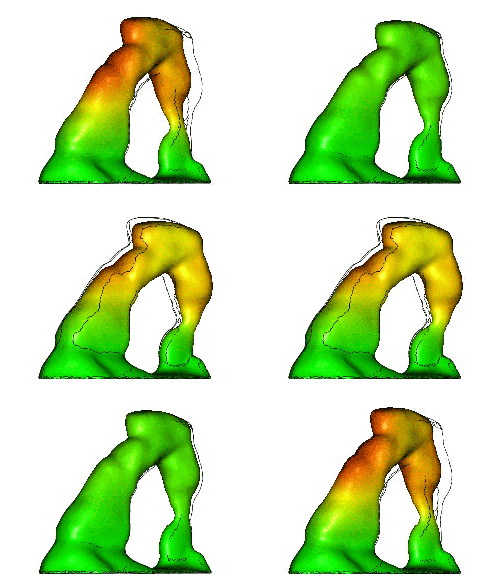
The Dynamics of Rock Arches All Images Courtesy Prof Jeff Moore
[Prof Moore] and his team aren’t just placing seismometers on natural rock arches for the fun of it, even though that does sound like some fun. Instead, they are studying the natural resonances of these rock formations- both the primary frequencies and the harmonics. By monitoring changes in their resonant frequencies over time, they gain an understanding of how the rock is changing- especially as it relates to the impact that humans have on these natural wonders.
What’s more, these audible representations of seismic waves are something that may be possible for the determined hacker. We’ve featured several DIY seismometers such as this hacked USB mouse designed to detect elephants on the move. Could it be sensitive enough for measuring seismic activity? Try it out, and let us know!
Special thanks to [Prof. Jeff Moore] for permission to use the images for this article.