Sometimes debugging just doesn’t go the way you want it to. When USB problems arise, you can usually use a protocol analyzer to find the issue causing trouble. For [Paul Stoffregen], it was only the first step in a long process to find the culprit.
Procotol Analyzer
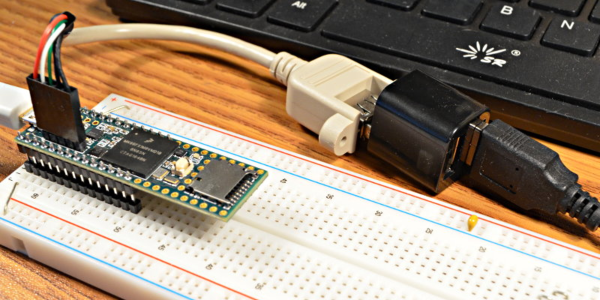
The complaint that came up was from a customer whose 2 port USB hub wasn’t working on their Teensy 3.6. The hub had been tested on Linux, Mac, and Windows, so it made sense to test what was different about the Teensy. Furthermore, all other USB hubs worked on the Teensy. As it turns out, these weren’t the most helpful assumptions to make when finding the bug.
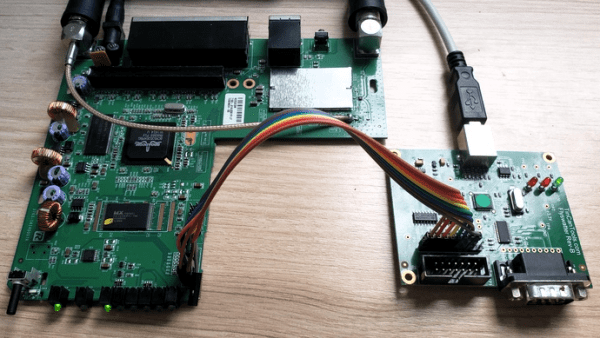
Any protocol analyzer can be used, for instance the Beagle480. The way it works is by passing through USB communication, making a copy of the communication coming in and out, and sending it to the PC.
Normally, the analyzer has a small buffer memory and must sustain fast data flow. Unfortunately, this can occasionally cause software lockup. From what could be gathered from the verbose printing, USB descriptors were found for the hub. As it turns out, the faulty hub was a Multi-TT type hub, while most others are single TT (transaction translator).
Fixing Software Lockup
Since it was necessary to get the rest of the descriptor data, fixing the software lockup was the next step. Writing in a panic function – a breakpoint of sorts – into the code allowed the USB host’s power to terminate, and stepping through the program revealed that while the 2 port hub was initially being read, some issue arose afterwards.
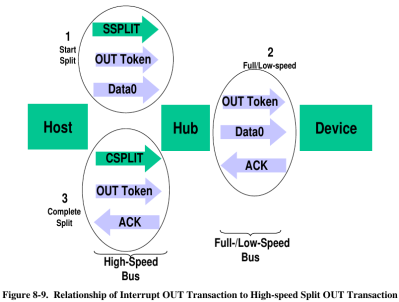
As it turns out, the issue relied on USB split transactions, used only between USB hosts and hubs. Communication happens by tokens, which begins with a SPLIT-START token.
As it turns out, the issue was that the tokens weren’t being sent in the correct order. The other hubs seemed to be handle this nevertheless. By applying a fix to the C++ code of the bad hub, which had previously not been implementing the data structure for accessing register properly, the hub was able to work again.The hub appeared to be rejecting bad token, which was causing the issue in the first place.
All in all, while I’m sure this had to be a head scratching experience, at least it gives us some insight into the low-level design of USB communication.