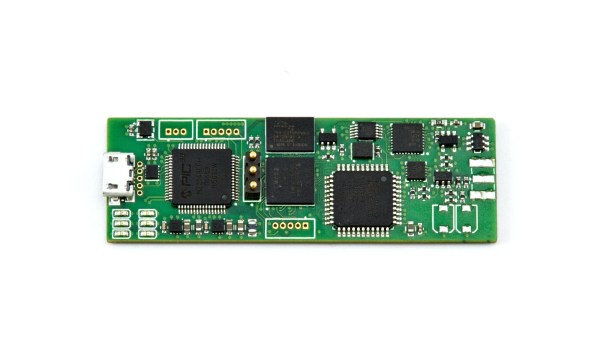
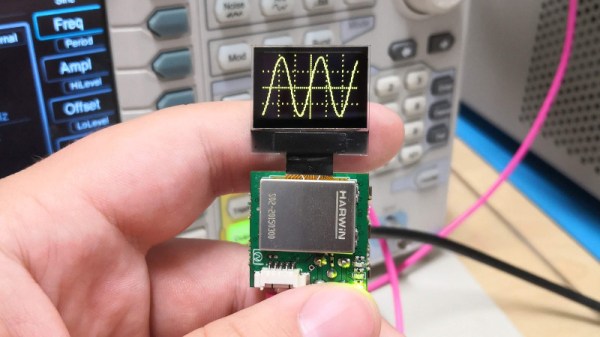
If you thought your handheld digital oscilloscope was the most transportable of your signal analyzing tools, then you’re in for a surprise. This oscilloscope made by [Mark Omo] measures only one square inch, with the majority of the space taken up by the OLED screen.
It folds out into an easier instrument to hold, and admittedly does require external inputs, so it’s not exactly a standalone tool. The oscilloscope runs on a PIC32MZ EF processor, achieving 20Msps and 1MHz of bandwidth. The former interleaves the processor’s internal ADCs in order to achieve its speed.
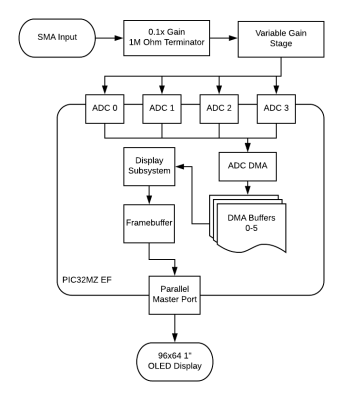
For the analog front-end the signals first enter a 1M ohm terminator that divide the signals by 10x in order to measure them outside the rails. They then get passed through a pair of diodes connected to the rails, clamping the voltage to prevent damage. The divider centers the incoming AC signal around 1.65V, halfway between AGND and +3.3V. As a further safety feature, a larger 909k Ohm resistor sits between the signals and the diodes in order to prevent a large current from passing through the diode in the event of a large voltage entering the system.
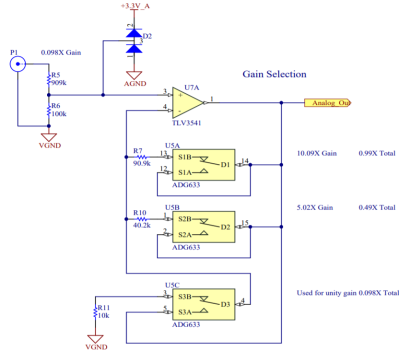
The next component is a variable gain stage, providing either 10x, 5x, or 1x gain corresponding to 1x, 0.5x, and 0.1x system gains. For the subsystem, a TLV3541 op-amp and ADG633 tripe SPDT analog switch are used to provide a power bandwidth around the system response due to driving concerns. Notably, the resistance of the switch is non-negligible, potentially varying with voltage. Luckily, the screen used in the oscilloscope needs 12V, so supplying 12V to the mux results in a lower voltage and thus a flatter response.
The ADC module, PIC32MZ1024EFH064, is a 12-bit successive approximation ADC. One advantage of his particular ADC is that extra bits of resolution only take constant time, so speed and accuracy can be traded off. The conversion starts with a sample and hold sequence, using stored voltage on the capacitor to calculate the voltage.
Several ADCs are used in parallel to sample at the same time, resulting in the interleaving improving the sample rate. Since there are 120 Megabits per second of data coming from the ADC module, the Direct Memory Access (DMA) peripheral on the PIC32MZ allows for the writing of the data directly onto the memory of the microcontroller without involving the processor.
The firmware is currently available on GitHub and the schematics are published on the project page.
Continue reading “The Cutest Oscilloscope Ever Made” →