All the components of the Piggymeter interface laid out on a silicon mat

Simple Optical Meter Sets New Standards For Documentation

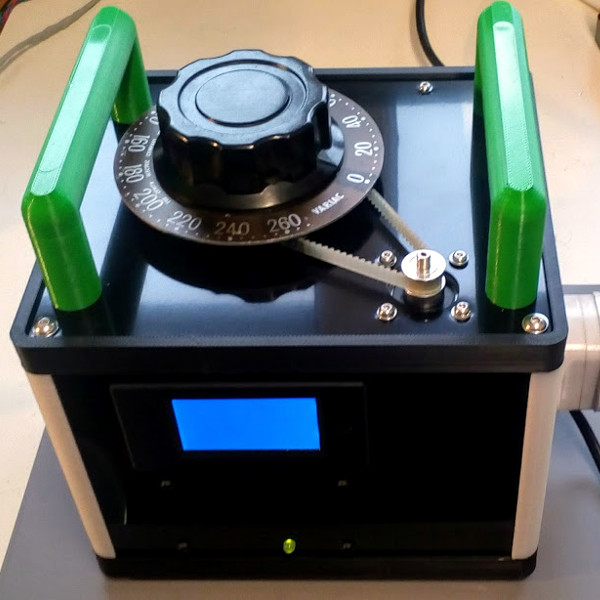
PiggyMeter is a wonderful example of a device that you never knew you needed – simple, elegant, easy to build, and accompanied by amazing documentation. It’s a snap-on interface for electric meters, dubbed so because its 3D printable shell looks like a pig nose, and it works with IEC62056-21 compliant meters. If you want to learn about your home’s power consumption in real time and your meter happens to fit the bill, look into building a PiggyMeter, it’s the kind of DIY project that a hacker was destined to design at some point.

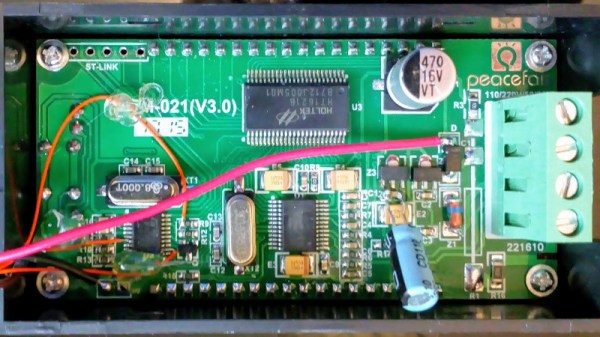
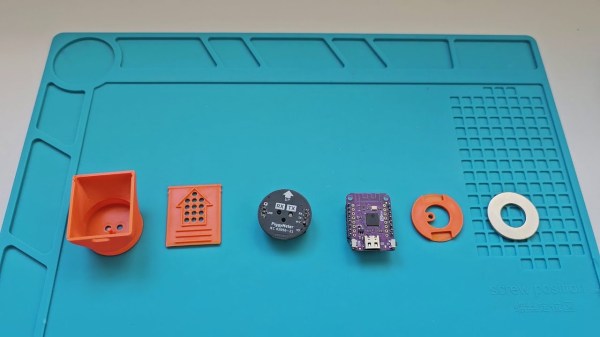
All you need is a printed shell, a Wemos-compatible development board with an ESP32 MCU, an optical interface board, and a few small parts like a ring magnet. The optical interface board is not open source, but there’s drawings available, and the design is pretty simple, so it should be trivial to recreate. Plus, it’s also reasonably inexpensive if you don’t want to build your own board. Got parts? Simply put them all together, flash the firmware, and you have a meter adapter added to your smart home device family.

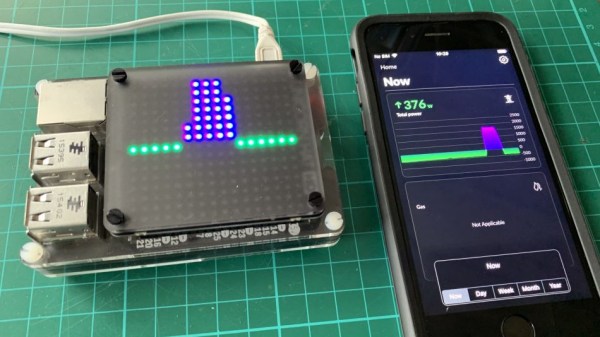
This device works with HomeAssistant, and it’s incredibly easy to set up, in part because of just how clearly everything is outlined in the blog post. Seriously, the documentation is written with love, and it shows. If you’re looking to learn how to document a device in a helpful way, take notes from the PiggyMeter. And, if you’d like to learn more about optically coupled power meter interfaces, here’s a different open source project we’ve covered before!

Smart Powermeter Uses E-Paper Display

In most places around the world, electricity is getting ever more expensive. Cutting back on your usage is one of the easier ways to escape this pain. This smart powermeter from [JGAguagdo] may prove a useful tool to achieve that goal.

The project uses an ESP32-S2 as the brains of the operation. It’s capable of reading up to six current-transformer clamps for measuring current draw in AC devices. It also features an embedded BMP280 temperature and air pressure sensor. Live data is displayed on a 2.9-inch e-Paper display, making it clear and easy to read under normal lighting conditions. By default, it’s set up to display graphs of power usage both over the last 24 hours, and the last ten days. It can even be set up with the prevailing energy rates in your area to display a realistic figure for what you’ll pay for your daily usage.

It can even be set up to work with Home Assistant for more logging and control options. We can imagine that, with a little work, you could even do some fancy plotting of energy use versus temperature to determine the performance and cost of your home HVAC setup.

If you want one with a minimum of fuss, you can score one on Tindie. Alternatively, design files are available on GitHub, too. We’ve featured some other great power meters over the years, and if you’re cooking up your own smart designs, don’t hesitate to let us know!

A PCB with an OLED display, a screw terminal block and a Raspberry Pi Zero board

Hackaday Prize 2023: Pi Pico Measures Volts, Amps And Watts

Measuring a voltage is pretty easy: just place your multimeter’s probes across the relevant pins and read the value. Probing currents is a bit trickier, since you need to open up the circuit and place your probes in series. Checking a circuit’s power consumption is the hardest, since you need to measure both voltage and current as well as multiply them at each moment in time. Fed up with having to hook up two multimeters and running a bunch of synchronized measurements, [Per-Simon Saal] built himself an automatic digital power meter.

The heart of this instrument is an INA219 chip, which can measure and digitize voltage and current simultaneously. It outputs the results through an I2C bus, which [Per-Simon] hooked up to a miniaturized version of the Raspberry Pi Pico called an RP2040-Zero. A screw terminal block is provided to connect the system to the device under test, while a 0.96″ OLED display shows the measured voltage, current and power.

A small OLED display showing voltage, current and power measurementsThe maximum voltage that can be measured is 26 V, while the current range is determined by the shunt resistor mounted on the board. The default shunt is 0.1 Ω, resulting in a 3.2 A maximum current range, but you can get pretty much any range you want by simply mounting a different resistor and changing the software configuration. In addition to displaying the instantaneous values, the power meter can also keep a log of its measurements – very useful for debugging circuits that use more energy than expected or for measuring things like the capacity of a battery.

There are lots of ways to measure electric power, but they all boil down to multiplying current and voltage in some way. The multiplication was done magnetically in the old days, but modern meters like [Per-Simon]’s of course use digital systems. Some can even plug directly into a USB port. If you want to measure mains power, transformers are an essential component for safety reasons.

Experimenting With 20 Meters Of Outlet Adapters

You may have seen some of the EEVblog dumpster dive videos, where [Dave Jones] occasionally finds perfectly good equipment that’s been tossed out. But this time, rather than a large screen monitor, desktop computer, or a photocopier, he features a stash of 283 electrical outlet double adapters that he found last year. He decided to perform a test in the parking lot, connecting all 283 adapters in series.

Using a pair of power meters and a 2 kW electric heater as a test load, [Dave] and his son [Sagan] measure the loss through this wild setup. It works out to about about 300 W, or roughly 1 W per adapter. He did a follow-up experiment using a FLIR thermal camera, and confirmed that the power loss is reasonably uniform, and that no single rogue adapter consuming all the lost power. After a back of the envelope calculation, we estimate this chain of adapters is about 20 meters long, making this whole thing entirely pointless but interesting nonetheless. Stick around until the end of the video for a teardown — they’re not as cheaply made as you might think.

[Dave]’s crazy experiment aside, we do wonder why someone had so many adapters to throw away in the first place. What would you have done with 283 adapters — left them in the dumpster or rescued them?

Continue reading “Experimenting With 20 Meters Of Outlet Adapters”

Electromagnetic Interference For Fun And Profit

There was an urban legend back in the days of mechanical electricity meters, that there were “lucky” appliances that once plugged in would make the meter go backwards. It probably has its origin in the interaction between a strongly capacitive load and the inductance of the coils in the meter but remains largely apocryphal for the average home user. That’s not to say that a meter can’t be fooled into doing strange things though, as a team at the University of Twente have demonstrated by sending some more modern meters running backwards. How have they performed this miracle? Electromagnetic interference from a dimmer switch.

Reading the paper (PDF link) it becomes apparent that this behavior is the result of the dimmer switch having the ability to move the phase of the current pulse with respect to the voltage cycle. AC dimmers are old hat in 2021, but for those unfamiliar with their operation they work by switching themselves on only for a portion of the mains cycle. The cycle time is varied by the dimming control. Thus the time between the mains zero-crossing point and their turn-on point is equivalent to a phase shift of the current waveform. Since electricity meters depend heavily upon this phase relationship, their performance can be tuned. Perhaps European stores will now brace themselves for a run on dimmer switches.

If you’re curious about these old-style dimmers, take a look at some of their basic functionality.

Thanks [Dorus] for the tip.

Live Energy Monitor Helps Plan Power-Hungry Appliance Use

There are a lot of good reasons to have a better understanding of one’s household power use, and that is especially true for those that do their own solar power collection. For example, [Frederick] determined that it would be more efficient to use large appliances (like a dishwasher or washing machine) when there was excess solar power available, but the challenge was in accessing the right data in a convenient way. His Raspberry Pi-based live energy monitor was the solution, because it uses an LED matrix to display live energy data that can be consulted at a glance.

Interestingly, this project isn’t about hacking the power meter. What this project is really about is conveniently accessing that data when and where it is best needed. [Frederick] has a digital power and gas meter with the ability to accept a small wireless dongle. That dongle allows a mobile phone app to monitor power usage, including whether power is being taken from or exported to the grid.

Since [Frederick] didn’t want to have to constantly consult his mobile phone, a Raspberry Pi using a Pimoroni Unicorn HAT HD acts as a glanceable display. His Python script polls the power meter directly over WiFi, then creates a live display of power usage: one LED for every 250 W of power, with the top half of the display being power used, and the bottom half representing power exported to the grid. Now the decision of when to turn on which appliances for maximum efficiency is much easier, not by automating the appliances themselves, but simply by displaying data where it needs to be seen. (This kind of thing, incidentally, is exactly the idea behind the Rethink Displays challenge of the 2021 Hackaday Prize.)

As for those of us without a digital power meter that makes it easy for residents to access power data? It turns out there is no reason a power meter’s wireless service interface can’t be sniffed with RTL-SDR.

DIY Variacs Get ESP8266 Upgrades

If you’be been hacking and making long enough, you’ve probably run into a situation where you realize that a previous project could be improved with the addition of technology that simply wasn’t available when you built it. Sometimes it means starting over from scratch, but occasionally you luck out and can shoehorn in some new gear without having to go back to the drawing board.

The two isolated variacs that [nop head] built were already impressive, but with the addition of the ESP8266 he was able to add some very slick additional features which really took them to the next level. He’s done an exceptional job detailing the new modifications, including providing all the source for anyone who might be walking down a similar path.

His variacs have digital energy meters right in the front panel which give voltage, amps, and a real-time calculation of watts. After reading an article by [Thomas Scherrer] about sniffing the SPI data out of one of these meters with an Arduino, [nop head] reasoned he could do the same thing with an ESP8266. The advantage being that he could then pull that data out over the network to graph or analyze however he wishes.

For his older variac, he decided to automate the device by adding a stepper and belt to turn the knob. The stepper is controlled by a Pololu stepper driver, which in turn get’s its marching orders from another ESP8266. He even came up with a simple web interface which allows you to monitor and control the variac from your smart device.

We don’t often see many variacs around these parts, and even fewer attempts at building custom ones. It’s one of those pieces of equipment you either can’t live without, or have never even heard of.