JTAG & SWD Debugging On The Pi Pico

[Surya Chilukuri] writes in to share JTAGprobe — a fork of the official Raspberry Pi debugprobe firmware that lets you use the low-cost microcontroller development board for JTAG and SWD debugging just by flashing the provided firmware image.

We’ve seen similar projects in the past, but they’ve required some additional code running on the computer to bridge the gap between the Pico and your debugging software of choice. But [Surya] says this project works out of the box with common tools such as OpenOCD and pyOCD.

As we’ve cautioned previously, remember that the Pi Pico is only a 3.3 V device. JTAG and SWD don’t have set voltages, so in the wild you could run into logic levels from 1.2 V all the way to 5.5 V. While being able to use a bare Pico as a debugger is a neat trick, adding in a level shifter would be a wise precaution.

Looking to get even more use out of those Pi Picos you’ve got in the parts bin? How about using it to sniff USB?

38C3: Xobs On Hardware Debuggers

If you just want to use a debugger for your microcontroller project, you buy some hardware device, download the relevant driver software, and fire up GDB. But if you want to make a hardware debugger yourself, you need to understand the various target chips’ debugging protocols, and then you’re deep in the weeds. But never fear, Sean [Xobs] Cross has been working on a hardware debugger and is here to share his learnings about the ARM, RISC-V, and JTAG debugging protocols with us.

He starts off with a list of everything you need the debugger hardware to be able to do: peek and poke memory, read and write to the CPU registers, and control the CPU’s execution state. With that simple list of goals, he then goes through how to do it for each of the target chip families. We especially liked [Xobs]’s treatment of the JTAG state machine, which looks pretty complicated on paper, but in the end, you only need to get it in and out of the shift-dr and shift-ir states.

Continue reading “38C3: Xobs On Hardware Debuggers”

Cranking Up The Detail In A Flight Simulator From 1992

Nostalgia is a funny thing. If you experienced the early days of video games in the 1980s and 90s, there’s a good chance you remember those games looking a whole lot better than they actually did. But in reality, the difference between 2023’s Tears of the Kingdom and the original Legend of Zelda is so vast that it can be hard to reconcile the fact that they’re both in the same medium. Of course, that doesn’t mean change the way playing those old games actually makes you feel. If only there was some way to wave a magic wand and improve the graphics of those old titles…

Well, if you consider Ghidra and a hex editor to be magic wands in our community, making that wish come true might be more realistic than you think. As [Alberto Marnetto] explains in a recent blog post, decompiling Stunt Island and poking around at the code allows one to improve the graphical detail level in the flight simulator by approximately 800%. In fact, it’s possible to go even higher, though at some point the game simply becomes unplayable.

Continue reading “Cranking Up The Detail In A Flight Simulator From 1992”

Roll Your Own Python Debugger

Debugging might be the one thing that separates “modern” programming from “classic” programming. If you are on an old enough computer — or maybe one that has limited tools like some microcontrollers — debugging is largely an intellectual exercise. Try a program, observe its behavior, and then try again. You can liberally sprinkle print statements around if you have an output device or turn on LEDs or digital outputs if you don’t. But with a debugger, you can get a bird’s-eye view of your program’s data and execution flow.

For some languages, writing a debugger can be hard — you usually use at least some system facility to get started. But as [mostlynerdness] shows, Python’s interpreter wants to help you create your own debugger, and you can follow along to see how it’s done. This is accessible because Python has a built-in debugging core that you can use and extend. Well, regular Python, that is. MicroPython has some low-level support, and while we’ve seen attempts to add more, we haven’t tried it.

Of course, you may never need to build your own debugger — most of the IDEs have already done this for you, and some of the code is, in fact, lifted from an open code base and simplified. However, understanding how the debugging plumbing works may give you a leg up if you need to create custom logic to trap an error that would be difficult to find with a generic debugger. Plus, it is just darn interesting.

Like many Python things, there are some version sensitivities. The post is in four parts, with the last two dealing with newer API changes.

We can’t promise that Python can debug your hardware, though. We always thought the C preprocessor was subject to abuse, but it turns out that Python has the same problem.

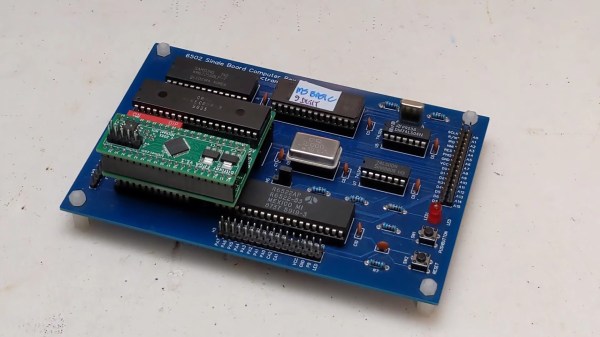
A 6502-based single-board computer with a ROMulator attached

Debug Your Senile Computers With The ROMulator

Some of you may have heard of the ROMulator, a device that can emulate RAM and ROM on 6502-based computers. But how does it work? How do you use it? What computers is it compatible with? [Jeff Tranter] covers that and more in his review of the ROMulator 6502.

The ROMulator is an FPGA-based board that slots between the 6502 and its socket on whatever computer it came from. It can emulate, but not intercept, accesses to RAM and ROM, which can be used to e.g. replace a ROM that you’re swapping very often or expand the RAM available to the CPU.

In his review, [Jeff] shows the ROMulator in action many computers, notably his custom 6502-based computer, a replica of an Apple 1 and two different replicas of the SUPERBOARD 2. He shows how the ROMulator can be configured, tested, used to debug the computers and even expand their RAM. Overall, [Jeff] thinks it’s a useful 6502 debugger that would have saved him lots of time in the past and we definitely agree.

Continue reading “Debug Your Senile Computers With The ROMulator”

A 6502 Overlay Debugger

Retired hardware engineer [Plasmode] recently took on the challenge of building a debugger for the 6502 designed to sit atop the microprocessor while seated in a solder less breadboard. The result is the Diagnostic Overlay for W65C02 Breadboard, consisting of 128 kB SRAM and a 1250-gate CPLD. Except being 0.8 in wide, the overlay debugger is otherwise the same size as the 6502’s 40-pin DIP package, so it doesn’t overhang other portions of your circuit.

Being an initial concept prototype, [Plasmode] mounted the chips dead-bug style on perf board — a process he himself found tiring. If he builds additional debuggers, presumably he will consider making a PCB.

The prototype was constructed using point-to-point soldering with 30-ga wire wrap wire.  It was all done under the inspection microscope.  There are not many connections, but they are rather tedious so I can only do a dozen or so wires per session.  It took me 2 days and several hours total to finish the prototype board.

This design is based on the CRC65 Frugal 6502 Single Board Computer, of course omitting the 6502 itself. Instead of a physical ROM memory chip, he implemented a 64-byte boot loader inside the CPLD and a serial port. This lets him to bootstrap the system over the serial port. He plans on expanding this to include other DIP-packaged retro microprocessors in the future. Check out his Hackaday.io project page ( above ). If you want to dig deeper, he posted the schematics here.

A Usable Arduino Debugging Tool

For as popular as the Arduino platform is, it’s not without its problems. Among those is the fact that most practical debugging is often done by placing various print statements throughout the code and watching for them in the serial monitor. There’s not really a great way of placing breakpoints or stepping through code, either. But this project, known as eye2see, hopes to change that by using the i2c bus found in most Arduinos to provide a more robust set of debugging tools.

The eye2see software is set up to run on an Arduino or other compatible microcontroller, called the “probe”, which is connected to the i2c bus on another Arduino whose code needs to be debugged. Code running on this Arduino, which is part of the eye2see library, allows it to send debugging information to the eye2see probe. With a screen, the probe can act as a much more powerful debugger than would otherwise typically be available, being able to keep track of variables in the main program, setting up breakpoints, and outputting various messages on its screen.

The tool is not without its downsides, though. The library that needs to run on the host Arduino slows down the original program significantly. But for more complex programs, the tradeoff with powerful debugging tools may be worth it until these pieces of code can be removed and the program allowed to run unencumbered. If you’d like to skip needing to use a second Arduino, we’ve seen some other tools available for debugging Arduino code that can run straight from a connected PC instead.