If you’re into retro CPUs and don’t shy away from wiring old-school voltages, [Mark]’s latest Intel 8080 build will surely spark your enthusiasm. [Mark] has built a full system board for the venerable 8080A-1, pushing it to run at a slick 3.125 MHz. Remarkable is that he’s done so using a modern Microchip FPGA, without vendor lock-in or proprietary flashing tools. Every step is open source.
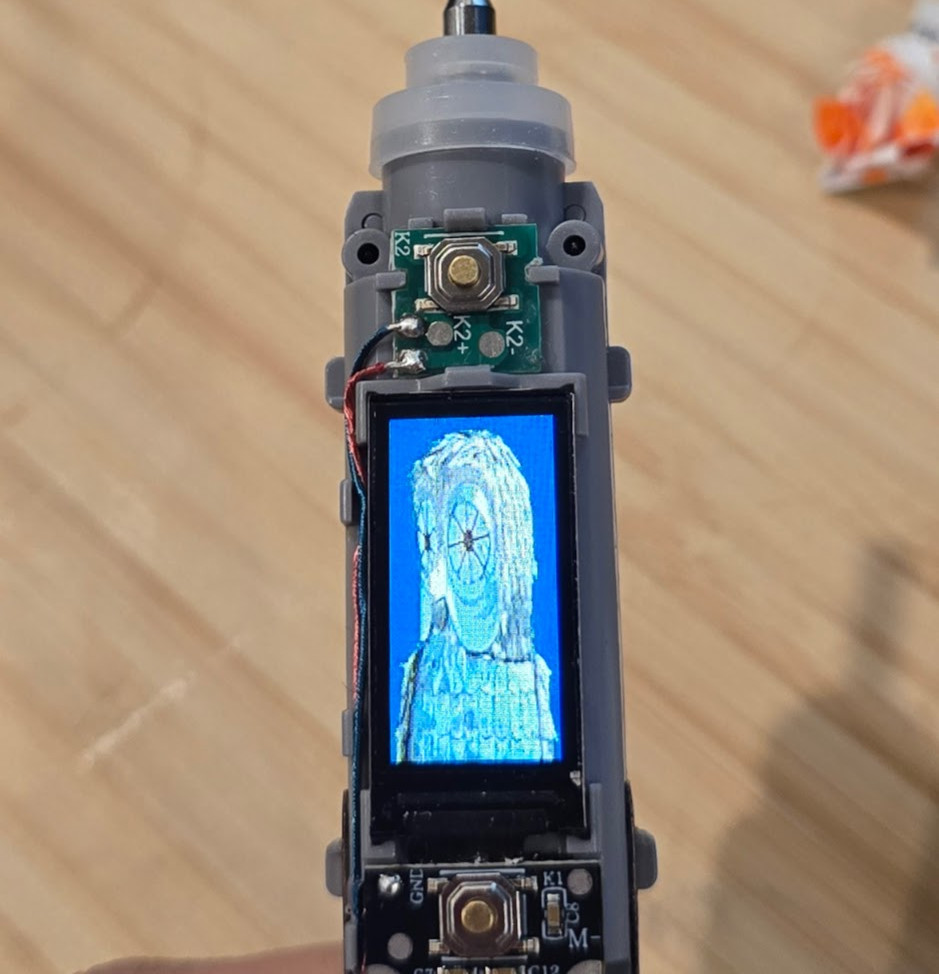
Getting this vintage setup to work required more than logical tinkering. Mark’s board supplies the ±5 V and +12 V rails the 8080 demands, plus clock and memory interfacing via the M2GL005-TQG144I FPGA. The design is lean: two-layer PCB, basic level-shifters, and a CM32 micro as USB-to-UART fallback. Not everything went smoothly: incorrect footprints, misrouted gate drivers, thermal runaway in the clock section; but he managed to tackle it.
What sets this project apart is the resurrection of a nearly 50-year-old CPU. It’s also, how thoroughly thought-out the modern bridge is—from bitstream loading via OpenOCD to clever debugging of crystal oscillator drift using a scope. [Mark]’s love of the architecture and attention to low-level detail makes this more than a show-off build.
Continue reading “Vintage Intel 8080 Runs On A Modern FPGA”