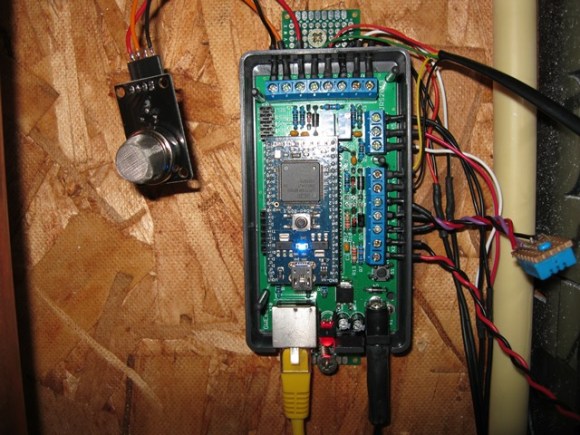
Wristwatch Measures Your Perception Of Time; Also Tells Time

This wristwatch is hiding a lot of features in its hardware and its software. It’s called the TicTocTrac and it’s a Senior project for a pair of students at Cornell University. Judging from the sheer volume and quality of the project documentation we wonder if someone has a science writing career ahead of them? Be we digress… It’s a clock and we love it!

First off, this does more than just tell the time. In fact, that’s almost an ancillary function in this case. The wristwatch is more of a metering device to record your own time-based behaviors. Find yourself checking your watch frequently as the lunch break approaches? This watch records that activity and you can later graph the data. This allows you to analyze how you percieve the passage of time. The more often you check the time, the slower you feel time progressing. The documentation does a much better job of describing this than we have time for, so check it out.

On the hardware side of things we’re quite impressed. The housing is 3D printed. It hides two half-circle PCBs below the full-circle PCB face plate. The half-boards leave space for a tiny rechargeable battery, and host a vibrating motor and RTC chip. Instead of using buttons, there’s a piezo sensor which detects when you tap on the top of the watch.

Harvesting And Graphing Wireless Household Utility Meter Info

Both our electrical meter and our gas meter are located in the basement of our house (we recently had the gas meter moved outside though). When people see this they always ask if the meter readers have to come inside once a month. The answer is no, these meters broadcast usage data which is picked up once a month when a utility company vehicle drives down the street. If you have wireless meters in your house, here’s a way to harvest and graph the wireless data so that you can analyze your usage patterns.

The hardware used here is a special USB dongle. This has a 900 MHz radio which picks out the packets from a reasonably large list of meter types, and pushes them through the USB interface. In the image above you can see that an Arduino with a USB host shield is used, but there are also drivers if you want to connect this directly to your computer.

We looked around and didn’t find any specifics on the hardware used on that board. But it can’t be all that hard to make one of these at home… the populated board seems to have just two ICs and a few passive components. Anyone up to the challenge of hacking together their own packet sniffer? We wonder if the Next HOPE badge could pull down the data?

[Thanks Chris]

Polish Your Understanding Of Capacitors By Building This Meter

Building a capacitance meter is a great exercise. If you’re feeling quite safe in your digital-circuit-only life, this will push just far enough out of the comfort zone for you to see there’s nothing to fear in adding analog circuits to your designs. Here, [Raj] compares a voltage divider and RC timer to calculate the value of a capacitor. The project is aimed at teaching the concepts, and will be easy to follow for anyone who has at least a bit of experience working with a programmable microcontroller.

The meter is based on an established equation that uses are starting and ending voltage, as well as the time it took to transition between the two, to calculate capacitance. The capacitor will be charged from 0 volts to 0.5 volts. Using the built-in analog comparator is the easiest way to do this. [Raj] breadboarded a voltage divider to establish a 0.5V reference on one of the comparator’s pins. The other input comes from a circuit that places a resistor in line with the capacitor being tested. When that reading rises above the 0.5 volt reference the comparator match will be tripped, stopping a timer that had been running during the charge cycle. From there it’s just a matter of using the timer value in the calculation.

Simple Hardware And Python Drive This Splunk LED Meter

Want to monitor the company system without continually loading up the Splunk dashboard? It turns out that they’ve got their own Python package which makes pulling down data a snap. All [Rick] needed to do was hook up an LED meter as an external display.

It used to be that this would take a lot of wire and bit of soldering (or some special Christmas lights), but the advent of affordable LED strips has really taken the guess-work out of it. He’s using an RGB version acquired from Adafruit Industries. These strips are driven using SPI and multiple-colors mean you can display multi-dimensional data using one column. He chose to use a Teensy microcontroller, grabbing some plastic packaging for welding rods as the enclosure. These strips are extremely bright and to help soften the impact he added wax paper to the inside of the enclosure to act as a diffuser.

Looking for more projects that use strips like this one? They make fantastic addressable accent lighting for your home.

Quick Project: Hard Drive System Meter

[Ginge] sent in this fun little project. He gave himself 3 hours to complete a hack (not including research time) and managed to come up with this cool activity meter. He handles the entire project like it is some kind of contest. Ground rules are laid out, requiring practicality of the final product, minimum investment, and almost complete use of junk pile pieces.

Using an old hard drive for the frame of the project as well as the “dial” part of the meter, he hacked together a system load/ hdd and proc activity meter. The brains of the project are an AVR and he even implemented some PWM to smoothing things out. He goes into some fair detail on the construction of the thing (was the writeup included in your build time? -50 points!). Even though he’s using a piece that he manufactures and sells (OSIF), you could probably figure out how to do it without.

You can see a video of it in action after the break

Continue reading “Quick Project: Hard Drive System Meter”

555 Inductance Meter

[Apexys] is performing some experiments with switched-mode power supplies and needed to compare the inductance of the coils he was using. His multimeter doesn’t have an inductance testing function, but he does have a 555 timer on hand. He put the 555 and some other parts together to create his own L meter. The writeup includes the theory behind this meter, with an incoming AC source converted to a voltage by an RC network.

Once he’d worked out the design it was time to build the circuit. Instead of printing a circuit board he created what he calls a DCB; Drawn Circuit Board. We’ve got to admit that this was way faster than using toner transfer or soldering point-to-point. We also like his use of an Erlenmeyer flask and a torch to heat the etchant. We don’t make PCBs in the winter because our Cupric Chloride is too cold to use outside but that may change now. The final piece in the puzzle is an analog meter which he pulled from an extra microamp meter he had on hand. Check out the demo after the break.

Continue reading “555 Inductance Meter”

Edison Clock Uses Ammeter Plus Bulbs To Set Alarm

This is the Edison clock, designed by [David Krawczyk]. It shows time in the same way as the multimeter clock, regulating power to two analog needle meters. The feature that makes this one a bit different is the alarm. You can see the series of holes on the front of the base. These have a small light bulb socked in each, and correspond to hours and 5-minute increments. Insert two bulbs to set the alarm time, and make sure that the alarm knob points to ‘on’. As you can see above, the alarm has been set to 8:15. Hidden on the last image of the article above is a PDF with just a bit more explanation. Still, much has been left out so if you replicate this clock we want to hear about it.

[via Gizmodo and Walyou]