Pi Pico Calculates Water Usage

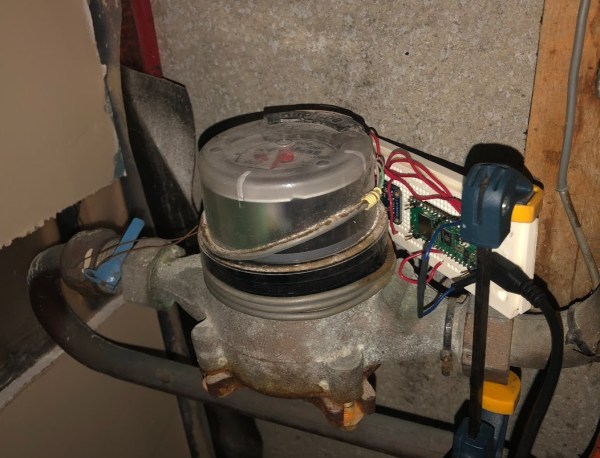
Modern WiFi-enabled microcontrollers have made it affordable and easy to monitor everything from local weather information to electricity usage with typically no more than a few dollars worth of hardware and a little bit of programming knowledge. Monitoring one’s own utility data can be a little bit more difficult without interfering with the metering equipment, but we have seen some clever ways of doing this over the years. The latest is this water meter monitoring device based on a Raspberry Pi Pico.

The clever thing here isn’t so much that it’s based on the tiniest of Raspberry Pis, but how it keeps track of the somewhat obscured water flow information coming from the meter. Using a magnetometer placed close to the meter, the device can sense the magnetic field created as water flows through the meter’s internal sensors. The magnetic field changes in a non-obvious way as water flows through it, so the program has to watch for specific peaks in the magnetic field. Each of these specific waveforms the magnetometer detects counts to 0.0657 liters of water, which is accurate for most purposes.

For interfacing with a utility meter, this is one of the more efficient and elegant hacks we’ve seen in a while. There have, of course, been other attempts to literally read the meter using web cams and computer vision software, but the configuration for these builds is much more complex than something like this. You can interface with plenty of utility meters other than water meters, too, regardless of age.

Inside Smart Meters Hack Chat

Join us on Wednesday, April 14 at noon Pacific for the Inside Smart Meters Hack Chat with [Hash]!

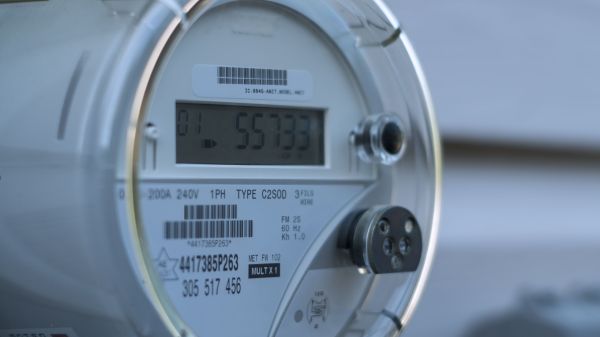
That electrical meter on the side of your house might not look like it, but it’s pretty packed with technology. What was once a simple electromechanical device that a human would have to read in person is now a node on a far-flung network. Not only does your meter total up the amount of electricity you use, but it also talks to other meters in the neighborhood, sending data skipping across town to routers that you might never have noticed as it makes its way back to the utility. And the smartest of smart meters not only know how much electricity you’re using, but they can also tease information about which appliances are being used simply by monitoring patterns of usage.

While all this sounds great for utility companies, what does it mean for the customers? What are the implications of having a network of smart meters all talking to each other wirelessly? Are these devices vulnerable to attack? Have they been engineered to be as difficult to exploit as something should be when it’s designed to be in service for 15 years or more?

These questions and more burn within [Hash], a hardware hacker and security researcher who runs the RECESSIM reverse-engineering wiki. He’s been inside a smart meter or two and has shared a lot of what he has learned on the wiki and with some in-depth YouTube videos. He’ll stop by the Hack Chat to discuss what he’s learned about the internals of smart meters, how they work, and where they may be vulnerable to attack.

join-hack-chatOur Hack Chats are live community events in the Hackaday.io Hack Chat group messaging. This week we’ll be sitting down on Wednesday, April 14 at 12:00 PM Pacific time. If time zones have you tied up, we have a handy time zone converter.

Click that speech bubble to the right, and you’ll be taken directly to the Hack Chat group on Hackaday.io. You don’t have to wait until Wednesday; join whenever you want and you can see what the community is talking about.
Continue reading “Inside Smart Meters Hack Chat”

Anatomy Of A Power Outage: Explaining The August Outage Affecting 5% Of Britain

Without warning on an early August evening a significant proportion of the electricity grid in the UK went dark. It was still daylight so the disruption caused was not as large as it might have been, but it does highlight how we take a stable power grid for granted.

The story is a fascinating one of a 76-second chain of unexpected shutdown events in which individual systems reacted according to their programming, resulted in a partial grid load shedding — what we might refer to as a shutdown. [Mitch O’Neill] has provided an analysis of the official report which translates the timeline into easily accessible text.

It started with a lightning strike on a segment of the high-voltage National Grid, which triggered a transient surge and a consequent disconnect of about 500MW of small-scale generation such as solar farms. This in turn led to a large offshore wind farm deloading itself, and then a steam turbine at Little Barford power station. The grid responded by bringing emergency capacity online, presumably including the Dinorwig pumped-storage plant we visited back in 2017.

Perhaps the most interesting part followed is that the steam turbine was part of a combined cycle plant, processing the heat from a pair of gas turbine generators. As it came offline it caused the two gas turbines feeding it to experience high steam pressure, meaning that they too had to come offline. The grid had no further spare capacity at this point, and as its frequency dropped below a trigger point of 48.8 Hz an automatic deloading began, in effect a controlled shutdown of part of the grid to reduce load.

This is a hidden world that few outside the high-power generation and transmission industries will ever see, so it’s very much worth a read. It’s something we’ve touched on before with the South American grid shutdown back in June, and for entirely different reasons in 2018 when an international disagreement caused the entire European grid to slow down.

Header image: Little Barford combined-cycle power station against the sunset. Tony Foster, (CC BY-SA 2.0).

ROS Gets Quick Sensor Debugging In The Terminal

Sensors are critical in robotics. A robot relies on its sensor package to perform its programmed duties. If sensors are damaged or non-functional, the robot can perform unpredictably, or even fail entirely. [Dheera Venkatraman] has been working to make debugging sensor issues easier with the rosshow package for Robot Operating System.

Normally, if you want to be certain a camera feed is working on a robot, normally you’d have to connect a monitor and other peripherals, check manually, then put everything away again when you’re finished. [Dheera] considered this was altogether too much of a pain for basic sensor checks.

Instead, rosshow uses the power of SSH to speed things along. Log in to the robot, fire off a few command line instructions, and rosshow will start displaying sensor data in the terminal on your remote machine. It’s achieved through the use of Unicode Braille art in the terminal.  Sure, you won’t get a full-resolution feed from your high-definition camera, and the display from the laser scanner isn’t exactly perfect. But it’s enough to provide an instant verification that sensors are connected and working, and will speed up those routine is-it-connected checks by an order of magnitude.

Robot Operating System is a particularly useful platform if you’re thinking about the software platform for your next build. If you do put something together, be sure to let us know.

Harvesting And Graphing Wireless Household Utility Meter Info

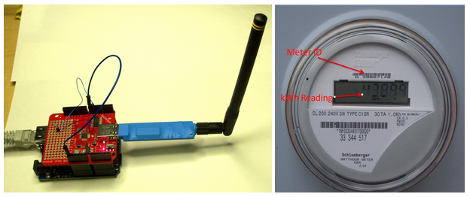
Both our electrical meter and our gas meter are located in the basement of our house (we recently had the gas meter moved outside though). When people see this they always ask if the meter readers have to come inside once a month. The answer is no, these meters broadcast usage data which is picked up once a month when a utility company vehicle drives down the street. If you have wireless meters in your house, here’s a way to harvest and graph the wireless data so that you can analyze your usage patterns.

The hardware used here is a special USB dongle. This has a 900 MHz radio which picks out the packets from a reasonably large list of meter types, and pushes them through the USB interface. In the image above you can see that an Arduino with a USB host shield is used, but there are also drivers if you want to connect this directly to your computer.

We looked around and didn’t find any specifics on the hardware used on that board. But it can’t be all that hard to make one of these at home… the populated board seems to have just two ICs and a few passive components. Anyone up to the challenge of hacking together their own packet sniffer? We wonder if the Next HOPE badge could pull down the data?

[Thanks Chris]