Tracing In 2D And 3D With Hall Effect Sensors

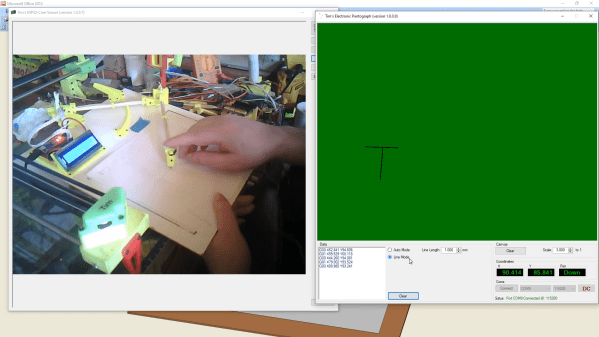
Pantographs were once used as simple mechanical devices for a range of tasks, including duplicating simple line drawings. [Tim] decided to make a modern electronic version that spits out G-Code instead.

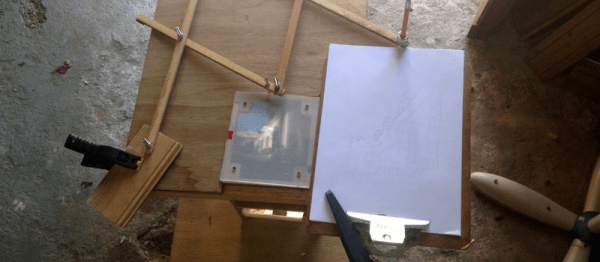
The design relies on a 3D-printed pantograph assembly, mounted upon a board as a base. A pair of Hall effect sensors are mounted in the pantograph, which, along with a series of neodymium magnets, can be used to measure the angles of the pantograph’s joints. The Hall sensors are read by an Arduino Nano, which computes the angles into movement of the pantograph head and records it as G-Code. This can simply be displayed on the attached LCD display, or offloaded to a computer for storage.

[Tim] explains the basic theory behind the work in an earlier piece, where he built a set of electronic dividers using the same techniques. He didn’t stop there, either. He also built a more complex version that works in 3D that he calls it the Electronic Point Mapper, which can be used to generate point clouds with a 3D-capable pantograph mechanism.

It’s a neat way to learn about geometry, and could even be useful if you’re doing some work in tracing 2D drawings or measuring 3D objects.

Continue reading “Tracing In 2D And 3D With Hall Effect Sensors”

Google And Apple Reveal Their Coronavirus Contact Tracing Plans: We Kick The Tires

Google and Apple have joined forces to issue a common API that will run on their mobile phone operating systems, enabling applications to track people who you come “into contact” with in order to slow the spread of the COVID-19 pandemic. It’s an extremely tall order to do so in a way that is voluntary, respects personal privacy as much as possible, doesn’t rely on potentially vulnerable centralized services, and doesn’t produce so many false positives that the results are either ignored or create a mass panic. And perhaps much more importantly, it’s got to work.

Slowing the Spread

As I write this, the COVID-19 pandemic seems to be just turning the corner from uncontrolled exponential growth to something that’s potentially more manageable, but it’s not clear that we yet see an end in sight. So far, this has required hundreds of millions of people to go into essentially voluntary quarantine. But that’s a blunt tool. In an ideal world, you could stop the disease globally in a couple weeks if you could somehow test everyone and isolate those who have been exposed to the virus. In the real world, truly comprehensive testing is impossible, and figuring out whom to isolate is extraordinarily difficult due to two factors: COVID-19 has a long incubation period during which it is nonetheless transmissible, and some or even most people don’t know they have it. How can you stop what you can’t see, and even when you can detect it, it’s a week too late?

One promising approach is to isolate those people who’ve been in contact with known cases during the stealth contagion period. To do this is essentially to keep a diary of everyone you’ve been in contact with for the last week or two, and then if you eventually test positive for COVID-19, alert them all so that they can keep from infecting others even before they test positive: track and trace. Doctors can do this by interviewing patients who test positive (this is the “contact tracing” we’ve been hearing so much about), but memory is imperfect. Enter a technological solution. Continue reading “Google And Apple Reveal Their Coronavirus Contact Tracing Plans: We Kick The Tires”

Tracing A Scene An Old-Fashioned Way

Taking a picture is as simple as tapping a screen. Drawing a memorable scene, even when it’s directly in front of you, is a different skill entirely. So trace it! Well, that’s kind of hard to do without appropriate preparation.

[bobsteaman]’s method is to first whip up a pantograph — it tested well with a felt marker on the end. Next, he built a camera obscura into a small wood box with a matte plexiglass top, which didn’t work quite so well. A magnifying glass above the camera’s pinhole aperture helped, but arduous testing was needed to ensure it was set at perfect position for a clear image. The matte plexiglass was also thrown out and, after some experimentation, replaced with a sheet of semi-transparent baking paper sandwiched between two pieces of clear plexiglass. The result is hard to argue with.

Continue reading “Tracing A Scene An Old-Fashioned Way”

Digitize Your Graphs With WebPlotDigitizer

Have you ever had to write a bit of code to interpret a non-linear analog reading as picked up by an ADC? When all you have to work with for your transfer function is a graph in a semiconductor datasheet that was probably written thirty years ago and prints out the size of a postage stamp, that’s a rather annoying task. Wouldn’t it be nice if you had access to the numbers behind the graph!

You can’t knock on the office door of the engineer who created it back in the ’80s, he’s probably  in retirement and playing golf or growing prize petunias by now. But you can digitize the graph to get yourself a lot closer to the action, and to help you in your quest there’s a handy online tool.

2N3904-current-gain
2N3904 current gain

WebPlotDigitizer is not new, it’s been around for quite a few years now. But it’s still worth talking about, because it’s one of those tools to keep in reserve. If you’ve ever needed it, you’ll know what we mean.

So how does it work? Load an image with a graph in it, select some points on the X and Y axis, roughly trace the curve with a marker tool, and set it in motion. Let’s give it a go. We’re going to try digitizing the current gain plot from the 2N3904 datasheet (PDF) that we examined a few days ago.

data-points
Data points!

So, open the WebPlotDigitizer app, load the graph image captured from the sheet as a JPEG. It asks what type of graph you’ve loaded, in this case a 2D X-Y plot. It asks you to identify four known points on the axes and supply their values. You also tell it if the axes are logarithmic at this point. Select “Automatic mode” on the right hand side, then click “Pen” and mark the graph trace, then select the colour of the trace. Click the “Run” button, and your data points appear. Hit the “View data” button, and there you have it. A few rogue points to remove perhaps, but it does a pretty good job.

If WebPlotDigitizer has engaged your interest, you’ll be pleased to know that it’s open-source, and you can find all its code on GitHub. There is also a handy video tutorial which you can see below the break. Continue reading “Digitize Your Graphs With WebPlotDigitizer”

Engauge Makes Graph Thieving A Cinch

We’ve seen ’em before: the charts and graphs in poorly photocopied ’80s datasheets, ancient research papers, or even our college prof’s chalkboard chicken scratch. Sadly, this marvelously plotted data is locked away in a poorly rendered png or textbook graphic. Fortunately, a team of programmers have come the rescue to give us the proper thieving tool to lift that data directly from the source itself, and that tool is Engauge.

Engauge is an open source software tool that enables to convert pictures of plots into the numerical representation of their data. While some of us might still be tracing graphs by hand, Engauge enables us to simply define reference points on the graph, and a clever image-processing algorithm extracts the curve for us automatically! Sure, there’s a little fine-tuning to determine what counts as data, but the net result is an all-in-one software tool that eats pictures and produces data–no intermediate steps required!

Engauge has been helping scientists and engineers preserve ancient data logs for years now, but it’s a tool that’s still fresh today when we’re recording from an analog o’scope or lifting those xs and ys off a textbook. In a world that’s increasingly digital, we’ve got the Engague developers to thank for arming us with the right tool for the job. All that said, If graph-thieving isn’t your thing, try spline-thieving to go from camera to CAD.

Engauge is a little lacking in the demo-video department, but we dug up a quickie on YouTube.

Thanks for the tip, [Jason]!

Continue reading “Engauge Makes Graph Thieving A Cinch”