Beats and rhymes are life in the world of hip-hop. A rapper’s ability to seamlessly merge the two is the mark of a master wordsmith. Ranking a rapper’s contributions to hip-hop will forever remain subjective, however [Matt] sought to apply a more quantitative approach to the matter. He created an interactive data set containing all the lyrics from over 150 rappers in order to determine which rapper’s vocabulary was the largest. Now everyone can know definitively which rapper’s rhymes truly are “the freshest”.
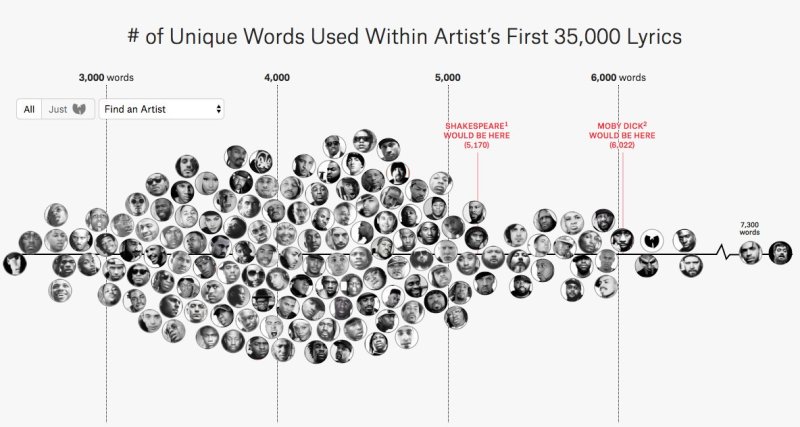
The study encompasses hip-hop artists from the last thirty years, pitting recent hit-makers like Lil Uzi Vert against veteran artists like KRS-One. To ensure everything is on even playing field [Matt] limited the study to the first 35,000 lyrics of each artist including any material on a mixtape, EP, or full album release. Rappers’ vocabulary was then plotted according to the total number of unique words found in their lyrics (i.e.: “shorty” and the alternative spelling “shawty” were each considered to be unique words). Oddly enough, there were some notable exclusions from the list as artists like Chance the Rapper, Queen Latifah, and The Notorious B.I.G’s discography did not exceed the 35,000 lyrics mark.
When digging into the data, there was a downward trend in the vocabulary used amongst popular artists of the last decade. [Matt] attributed this trend to the fact that many of these artists have modeled their music to reflect the pop/rock music structure that makes use of simple, repetitive choruses. While others may attribute this downward trend to a general lack of talent when it comes to lyricism, however, it should be noted that the economics of music streaming platforms have had an effect on the average song length. Though whatever era of hip-hop you subscribe to, it is always interesting to see where your favorite emcees rank.