A 6502 Overlay Debugger

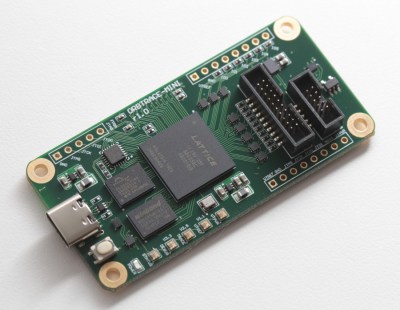
Retired hardware engineer [Plasmode] recently took on the challenge of building a debugger for the 6502 designed to sit atop the microprocessor while seated in a solder less breadboard. The result is the Diagnostic Overlay for W65C02 Breadboard, consisting of 128 kB SRAM and a 1250-gate CPLD. Except being 0.8 in wide, the overlay debugger is otherwise the same size as the 6502’s 40-pin DIP package, so it doesn’t overhang other portions of your circuit.

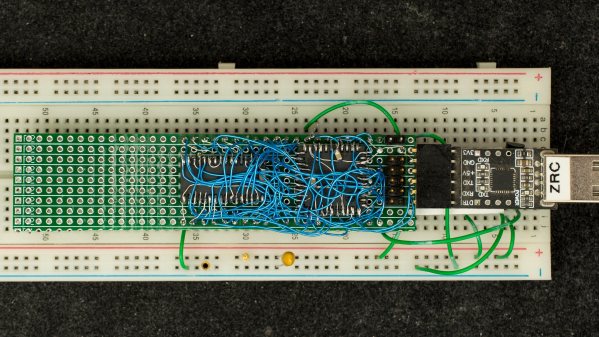
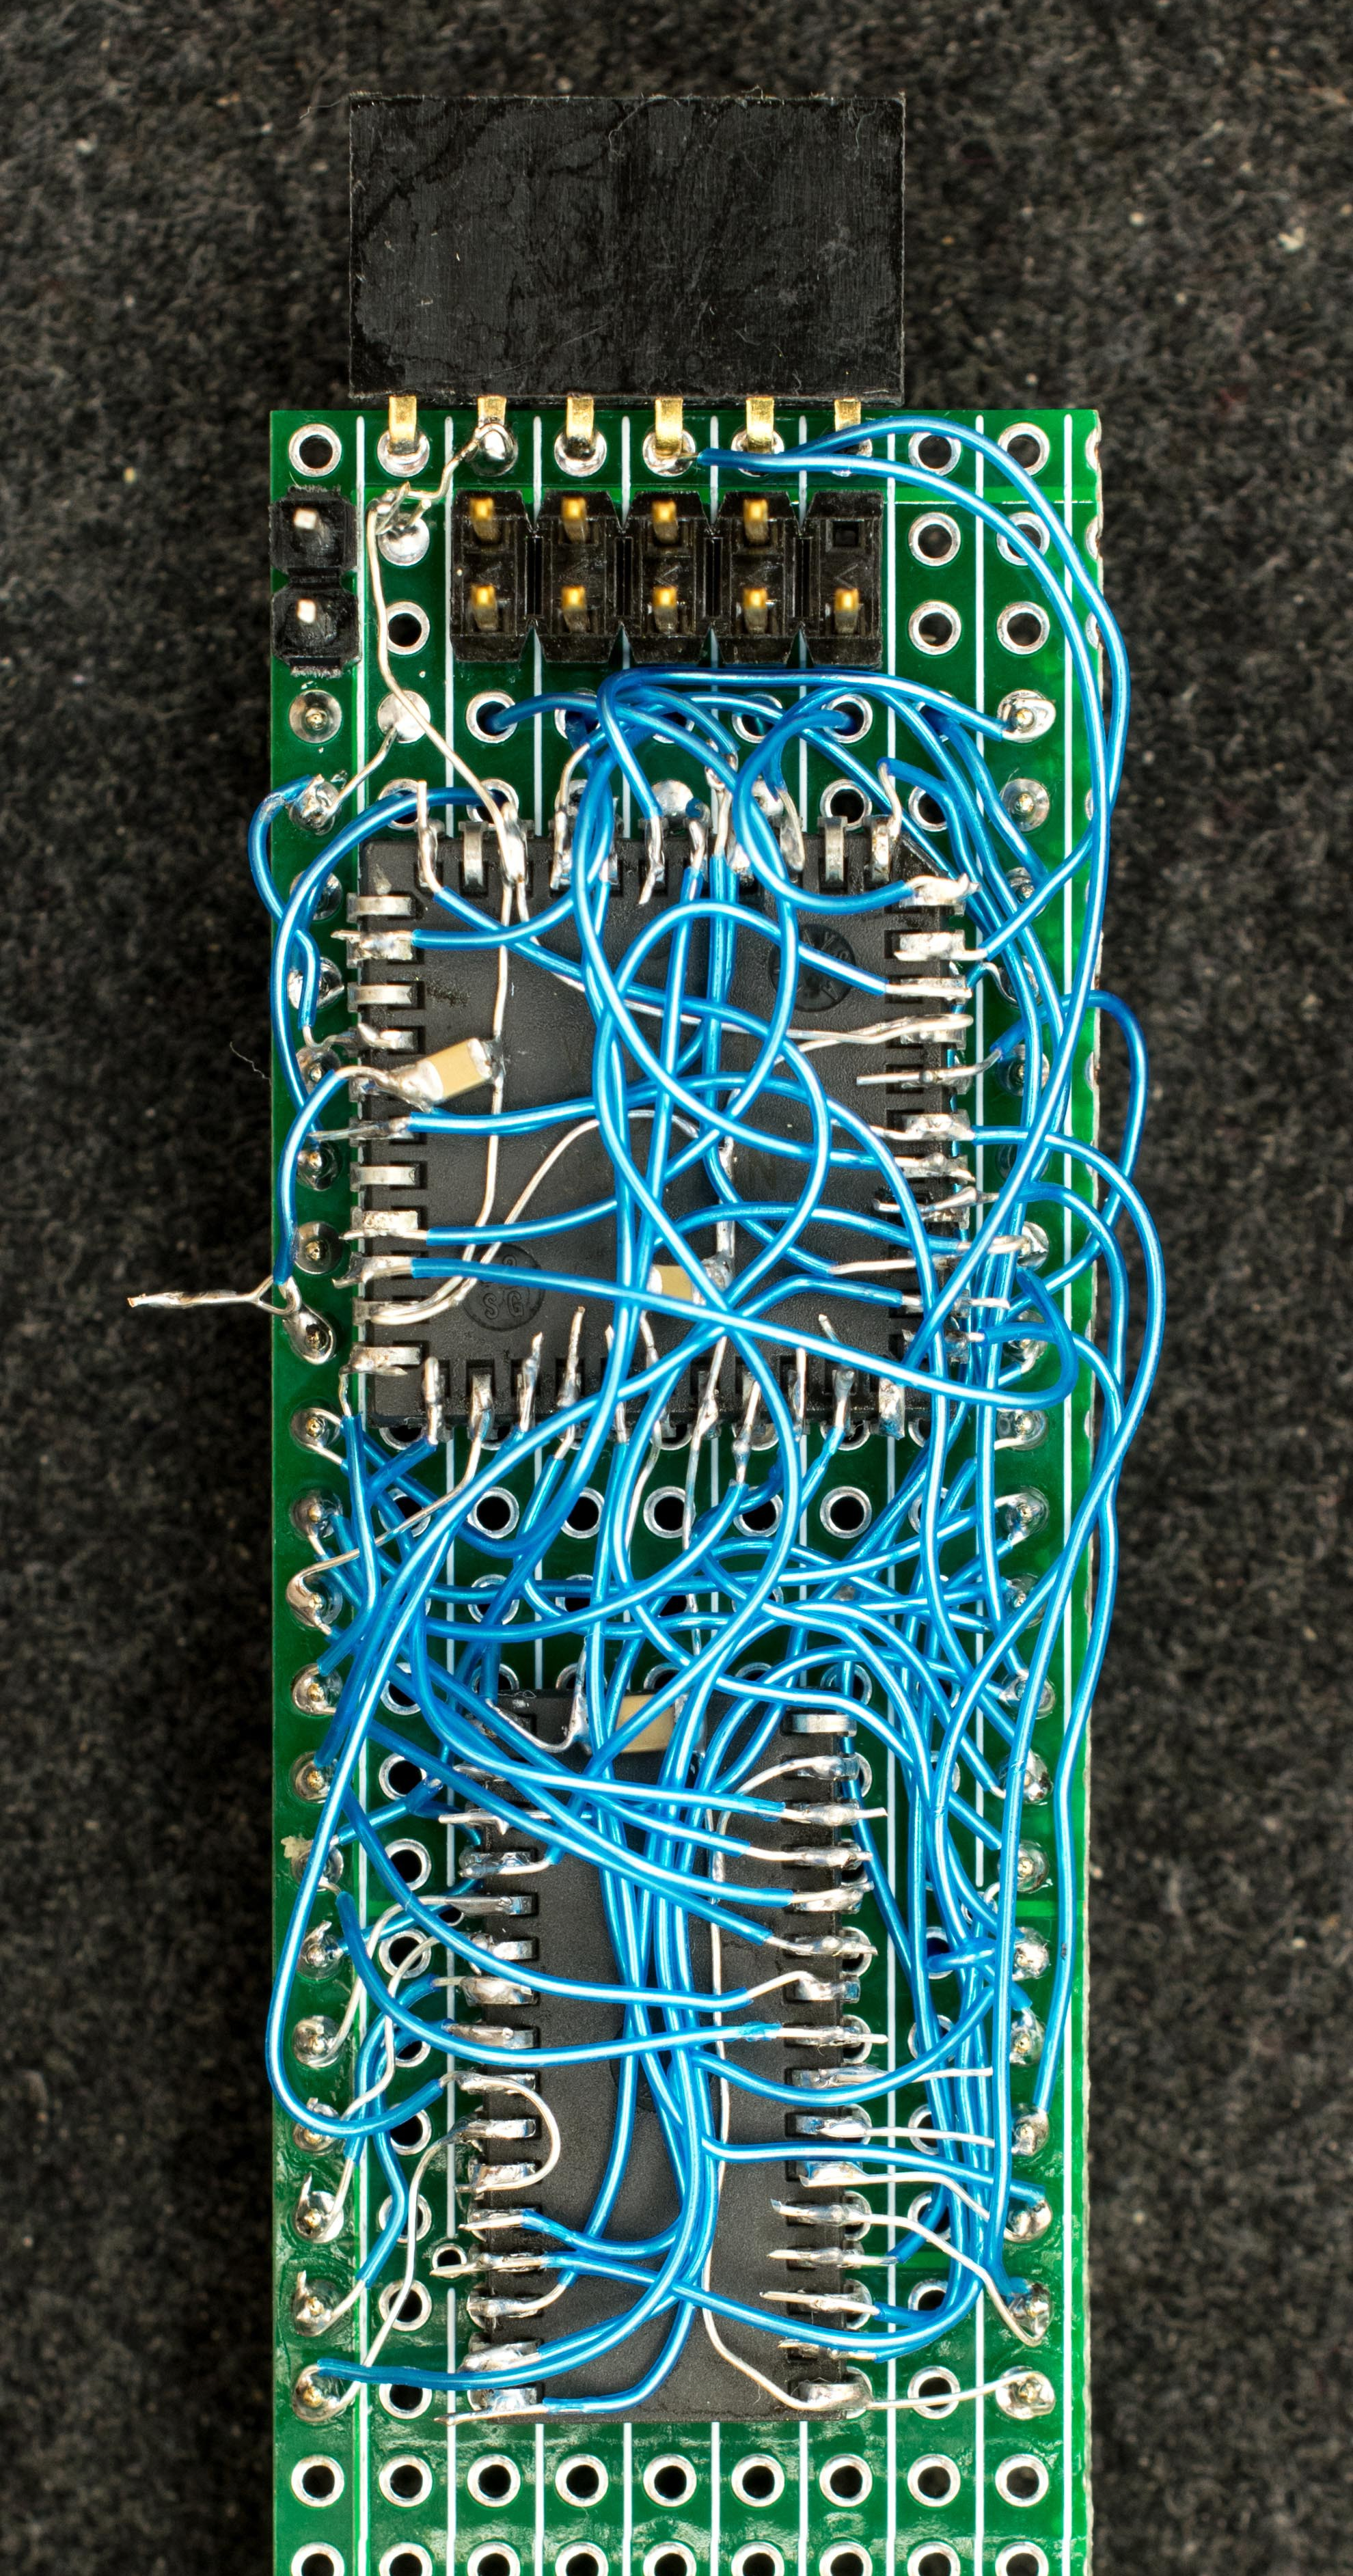
Being an initial concept prototype, [Plasmode] mounted the chips dead-bug style on perf board — a process he himself found tiring. If he builds additional debuggers, presumably he will consider making a PCB.

The prototype was constructed using point-to-point soldering with 30-ga wire wrap wire.  It was all done under the inspection microscope.  There are not many connections, but they are rather tedious so I can only do a dozen or so wires per session.  It took me 2 days and several hours total to finish the prototype board.

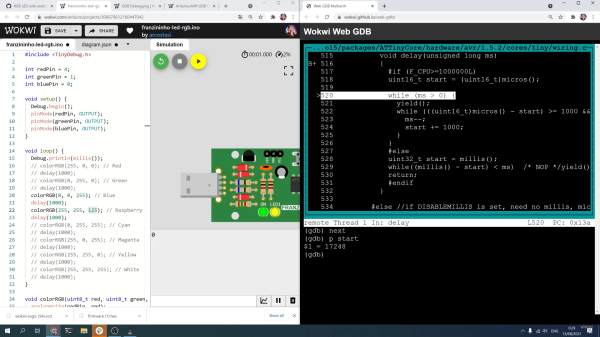
This design is based on the CRC65 Frugal 6502 Single Board Computer, of course omitting the 6502 itself. Instead of a physical ROM memory chip, he implemented a 64-byte boot loader inside the CPLD and a serial port. This lets him to bootstrap the system over the serial port. He plans on expanding this to include other DIP-packaged retro microprocessors in the future. Check out his Hackaday.io project page ( above ). If you want to dig deeper, he posted the schematics here.

A Usable Arduino Debugging Tool

For as popular as the Arduino platform is, it’s not without its problems. Among those is the fact that most practical debugging is often done by placing various print statements throughout the code and watching for them in the serial monitor. There’s not really a great way of placing breakpoints or stepping through code, either. But this project, known as eye2see, hopes to change that by using the i2c bus found in most Arduinos to provide a more robust set of debugging tools.

The eye2see software is set up to run on an Arduino or other compatible microcontroller, called the “probe”, which is connected to the i2c bus on another Arduino whose code needs to be debugged. Code running on this Arduino, which is part of the eye2see library, allows it to send debugging information to the eye2see probe. With a screen, the probe can act as a much more powerful debugger than would otherwise typically be available, being able to keep track of variables in the main program, setting up breakpoints, and outputting various messages on its screen.

The tool is not without its downsides, though. The library that needs to run on the host Arduino slows down the original program significantly. But for more complex programs, the tradeoff with powerful debugging tools may be worth it until these pieces of code can be removed and the program allowed to run unencumbered. If you’d like to skip needing to use a second Arduino, we’ve seen some other tools available for debugging Arduino code that can run straight from a connected PC instead.

HP1973 Project Highlights Workings Of HP-45 Calculator

[Sarah K Marr] dabbles in retrocomputing and has a fascination with the Hewlett Packard HP-45 calculator, the second calculator in HP’s series introduced in 1973. Over a year ago, she wrote an HP-45 emulator for use on a terminal, dubbed HP45TERM. Not content with success, she upped the challenge and decided to build an even better emulator with a full-featured GUI written in Python. Oh, and she made it multi-platform as well. The result is the HP1973 project.

[Sarah] thought it would take just a few days, but it grew into a much bigger project, as often happens. We’re glad it did because the results are fantastic. The emulator gives you access not only to the calculator itself but can see everything under the hood. The emulator provides full ROM visibility, hardware registers, and standard debugging operations like single stepping. ROM images are available for the HP-45, the HP-35, and the HP-80. The GUI display is configurable, and there’s a plethora of help and information explaining the calculator’s internals. Pre-built binaries are available for MacOS, Windows, and Python source code (3.10.10+) for all operating systems (you’ll need to `pip install numpy` first). The emulation is faithful to the original calculator, and even the hidden timer function can be accessed.

Check this out if you’re into retro calculators. Our own Al Williams wrote about the history of the HP-35 back in 2018 if you want to learn more. Thanks to [J Peterson] for sending in the tip.

The Orbtrace debugger hardware connected to a development board t hrough a 20-pin ribbon cable. The development board has a green LED shining.

ORBTrace Effort: Open Tool For Professional Debugging

There are some fairly powerful debugging facilities available on today’s microcontrollers — if your code crashes mysteriously, chances are, there’s a debugging interface that could let you track down the exact crash circumstances in no time. Sadly, debugging tools for these powerful interfaces tend to be prohibitively expensive and highly proprietary, thus, not friendly for hobbyists. Now, there’s a community-driven high-capability debugging platform called ORBTrace, brought to us by [mubes] and [zyp].

With parallel trace, you get a constant stream of consciousness, every exact instruction executed by your CPU. [mubes] and [zyp] set out to tap into the power of parallel trace debugging for Cortex-M processors. and the ORBTrace project was born. Relying on the Orbuculum project’s software capabilities, this FPGA-based debugger platform can do parallel trace and the more popular high-speed SWO trace – and way more. ORBTrace has the potential to grow into a powerful debug helper tool, with enough capabilities for anyone to benefit. And of course, it’s fully open-source.

The ORBTrace board, with a FPGA in the center of it, a USB-C connector on the left, and two IDC debug connectors on the right (one ten-pin and one twenty-pin)
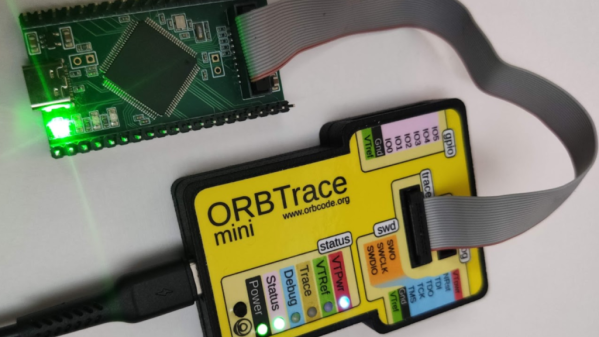
The ORBTrace platform has plenty of untapped potential. There’s the battle-tested JTAG and SWD that you can already use with all the open tools you could expect. However, there’s also plenty of available resources on the FPGA, including even a currently unutilized RISC-V softcore. If you wanted to add support for any other family of devices to this debugger, sky’s the limit! And, of course, there’s cool software to go with it – for example, orbmortem, which keeps a ring buffer of instructions in memory and shows you the last code executed before your CPU stops, or orbstat, a tool for profiling your embedded code.

If you’re looking to purchase effortless feature parity with Segger or Lauterbach devices, the ORBTrace doesn’t promise that. Instead, it’s an open debugging toolkit project, with hardware available for purchase, and software just waiting for you take control of it. This project’s community hangs out in the 1BitSquared discord’s #orbuculum channel, and gateware’s advancing at a rapid pace – welcoming you to join in on the fun.

ORBTrace is a powerful tool for when your goals become large and your problems become complex. And, being a community-driven experimental effort, we’ll undoubtedly see great things come out of it – like the Mooltipass project, originally developed by Hackaday community members, and still going strong.

Linux Fu: Up Your GDB Game!

If you want to buy a car, there are plenty of choices. If you want to buy a jetliner, there are fewer choices. If you want to use the Large Hadron Collider, you have a choice of exactly one. The harder something is to create, the less likely there is to be many of them. If you are looking for a Linux debugger, there are only a few choices, but gdb is certainly the one you will find most often. There is lldb and a handful of non-open commercial offerings, but for the most part you will use gdb to debug software on Linux.

Of course, not everyone’s a fan of gdb’s text-based interface, so there’s no shortage of front ends available for it. In fact, gdb has two potentially built-in interfaces although depending on how you install gdb, you might not have both of them. Of course, if you use an IDE, it very likely is a front end for gdb among other things. But at the core is gdb and — usually — there is a window somewhere that you can stuff gdb commands into. Even emacs — which might be considered the original IDE — can run gdb and gives you a sort-of GUI experience.

Continue reading “Linux Fu: Up Your GDB Game!”

Screenshot of debugging the Wokwi Arduino simulator

Digging Into An ATtiny Simulator Bug With GDB

Being able to track down a bug in a mountain of source code is a skill in its own right, and it’s a hard skill to learn from a book or online tutorial. Besides the trial-by-fire of learning while debugging your own project, the next best thing is to observe someone else’s process. [Uri Shaked] has given us a great opportunity to brush up on our debugging skills, as he demonstrates how to track down and squish a bug in the Wokwi Arduino simulator.

A user was kind enough to report the bug and include the offending Arduino sketch. [Uri]’s first step was to reduce the sketch to the smallest possible program that would still produce the bug.

Once a minimal program had been produced, it was time to check whether the problem was in one of the Arduino libraries or in the Wokwi simulator. [Uri] compiled the sketch, loaded it onto a ATtiny85, and compared the behavior of the simulator and the real thing. It turns out the code ran just fine on a physical ATtiny, so the problem must have been in the Arduino simulator itself.

To track down the bug in the simulator, [Uri] decided to break out the big gun—GDB. What follows is an excellent demonstration of how to use GDB to isolate a problem by examining the source code and using breakpoints and print statements. In the end, [Uri] managed to isolate the problem to a mis-placed bit in the simulation of the timer/counter interrupt flag register.

If you’d like to see more of [Uri]’s debugging prowess, check out his dive into an ATtiny’s write protection and configuration fuses. If you’ve been wowed by the power of GDB and want to learn more, check out this quick tutorial!

Continue reading “Digging Into An ATtiny Simulator Bug With GDB”

Debugging For Sed — No Kidding

If you do much Linux shell scripting, you’ve probably encountered sed — the stream editor — in an example. Maybe you’ve even used it yourself. If all you want to do is substitute text, it is easy and efficient. But if you try to do really elaborate editing, it is often difficult to get things right. The syntax is cryptic and the documentation is lacking. But thanks to [SoptikHa2] you can now debug sed scripts with a text-based GUI debugger. Seriously.

According to the author, the program has several notable features:

  • Preview variable values, both of them!
  • See how will a substitute command affect pattern space before it runs
  • Step through sed script – both forward and backward!
  • Place breakpoints and examine program state
  • Hot reload and see what changes as you edit source code
  • Its name is a palindrome

There’s only one word for that last feature: wow.

Continue reading “Debugging For Sed — No Kidding”