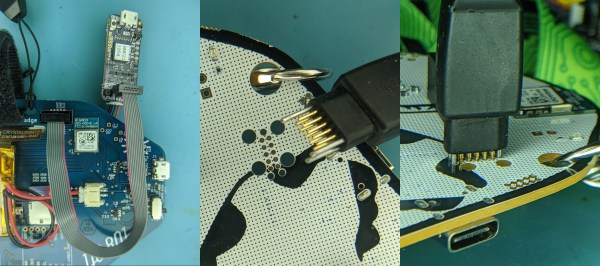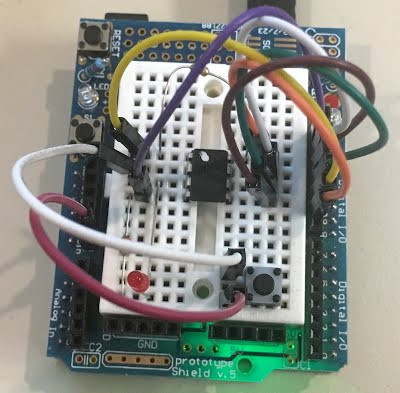
There have been plenty of Z80 computer builds here on Hackaday, but what sets them apart is what you do with them. [Andrew] writes in with his Z80 single-board computer made from scratch, using the Arduino standard headers for its I/O. In turn, since he needed an easy way to program the flash memory which holds the software to run on the Z80, he used an Arduino Mega as a debugger, making the SBC an Arduino shield itself.
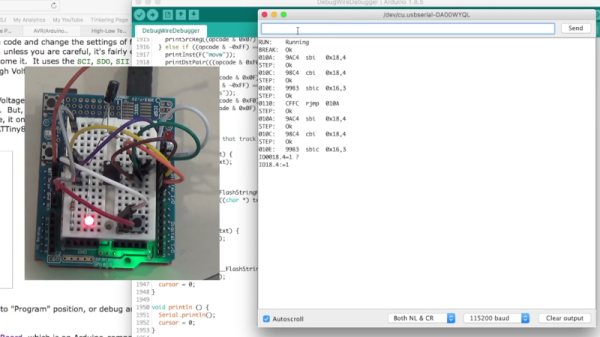
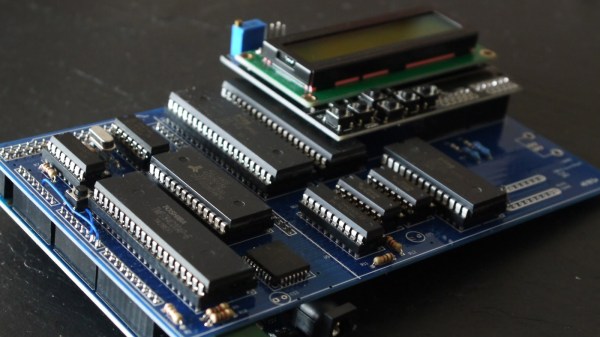
Using such a common header pinout for the Z80 computer allows it to be used with a variety of readily-available Arduino shields. This compatibility is achieved with an analog-digital converter and a 3.3 V regulator, mimicking the pins found in an Arduino Uno. The code, available on GitHub, includes an extensive explanation and walkthrough over the process in which the Mega takes over the bus from the Z80 to function as a fully-featured debugger. Programs can be loaded through embedding an assembly listing into the Mega’s sketch, or, once the debugger is up you can also upload a compiled hex file through the serial connection.
This isn’t the first time [Andrew] has been featured here, and his past projects are just as interesting. If you need to translate a Soviet-era calculator’s buttons into English, hack a metallurgical microscope or even investigate what’s that Clacking Clanking Scraping Sound, he’s the one you should call.