Office Supplies Make Math Sculptures If You Know What You’re Doing

Ever been fiddling around at your desk in the office, wondering if some grander structure might come from an assemblage of paper clips, pens, and binder clips? You’re not alone. Let your mind contemplate these beautiful maths sculptures from [Zachary Abel].

[Zachary] has a knack for both three-dimensional forms and the artistic use of color. His Möbius Clips sculpture ably takes 110 humble pieces of office equipment in multiple colors, and laces them into a continuous strip that has beguiled humanity for generations. The simple paper clip becomes a dodecahedron, a colorful spiralling ball, or a tightly-stitched box. He does great things with playing cards too.

What elevates his work is that there’s a mathematical structure to it. It’s so much more than a pile of stationary, there’s always a geometry, a pattern which your mind latches on to when you see it. He also often shares the mathematical background behind his work, too.

If you’re fumbling about with the contents of your desk drawer while another Zoom meeting drags on, you might want to challenge yourself to draw from [Zachary’s] example. If you pull off something fantastical, do let us know!


Making Art With Maxwell’s Equations

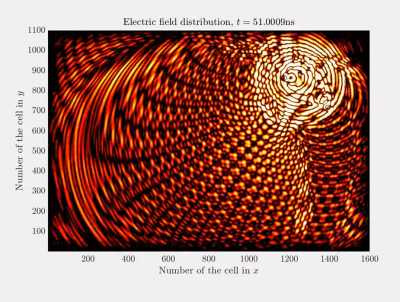
When you think of art, you might think of portraiture, landscapes, or other kinds of paintings. But mathematics can feel artistic at times, too. We’ve all seen gorgeous Mandelbrot fractals, and less gorgeous Julia fractals, but that’s not all that’s out there. As [Prof. Halim Boutayeb] demonstrates, Maxwell’s equations can show us some real beauty, too.

Find us a cooler graph than this one!

The work involves running simulations of multiple electromagnetic sources moving, bouncing around, interacting, and so on. The art comes in the plotting of the fields, in warm colors or just outright rainbows. The professor does a great job of pairing some of these videos with pumping electronic music, which only adds to the fun.

Of course, the colors are pretty, but there’s a lot of valuable physics going on behind all this. Thankfully, there are all kinds of additional resources linked for those eager to learn about the Finite Difference Time Domain method and how it can be used for valid simulation tasks.

Throw this kind of stuff on a projector at your next rave and you will not be disappointed. Video after the break.

Continue reading “Making Art With Maxwell’s Equations”

Organic Fibonacci Clock Is All About The Spiral

Whether you’re a fan of compelling Tool songs, or merely appreciate mathematical beauty, you might be into the spirals defined by the Fibonacci sequence. [RuddK5] used the Fibonacci curve as the inspiration for this fun clock build.

The intention of the clock is not to display the exact time, but to give a more organic feel of time, via a rough representation of minutes and hours. A strip of addressable LEDs is charged with display duty. The description is vague, but it appears that the 24 LEDs light up over time to show the amount of the day that has already passed by. The LEDs are wound up in the shape of a Fibonacci spiral with the help of a 3D printed case, and is run via a Wemos D1 microcontroller board.

It’s a fun build, and one that we can imagine would scale beautifully into a larger wall-hanging clock design if so desired. It at once could display the time, without making it immediately obvious, gradually shifting the lighting display as the day goes on.

We’ve seen other clocks rely on the mathematics of Fibonacci before, too. If you’ve cooked up your own fun clock build, don’t hesitate to let us know!
How To Hide A Photo In A Photo

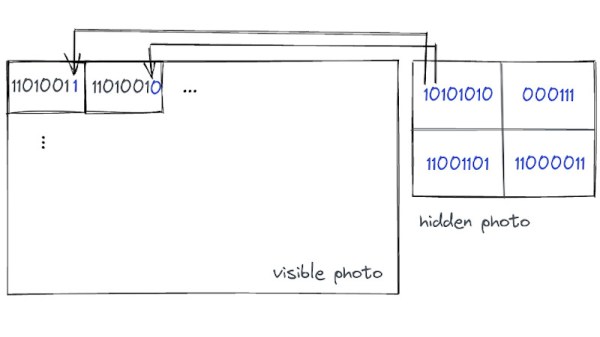
If you’ve ever read up on the basics of cryptography, you’ll be aware of steganography, the practice of hiding something inside something else. It’s a process that works with digital photographs and is the subject of an article by [Aryan Ebrahimpour]. It describes the process at a high level that’s easy to understand for non-maths-wizards. We’re sure Hackaday readers have plenty of their own ideas after reading it.

The process relies on the eye’s inability to see small changes at the LSB level to each pixel. In short, small changes in colour or brightness across an image are imperceptible to the naked eye but readable from the raw file with no problems. Thus the bits of a smaller bitmap can be placed in the LSB of each byte in a larger one, and the viewer is none the wiser.

We’re guessing that the increased noise in the image data would be detectable through mathematical analysis, but this should be enough to provide some fun. If you’d like a closer look, there’s even some code to play with. Meanwhile as we’re on the topic, this isn’t the first time Hackaday have touched on steganography.

Genaille’s Rods: When Paint Sticks Do Math

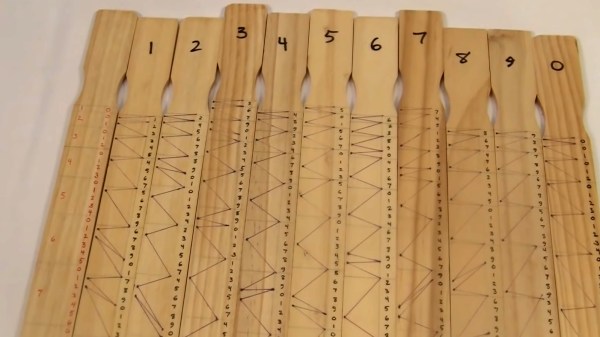
What is a hacker, if not somebody who comes up with solutions that other just don’t see? All the pieces may be in place, but it takes that one special person to view the pieces as greater than the sum of their parts. As [Chris Staecker] explains in the video below the break, Henri Genaille was one such person.

When French mathematician Edouard Lucas (himself well known for calculating the longest prime number found by hand) posed a mathematical problem at the French Academy, a French railway engineer named Henri Genaille developed the rods we’re discussing now.

Genaille’s Rods are designed to perform multiplication. But rather than require computation by the user, the rods would simply need to be laid out in the correct order. The solution could readily be found by just following the lines in the correct pattern. This might sound a lot like cheating, and that’s exactly what it is. No manual math needed to be done. Genaille also created rods for doing long division, which we’re sure were every bit as enthralling as the multiplication rods. Demonstrations of both are included in the video below.

While Genaille’s Rods have gone the way of the slide rule, we can’t help but wonder how many engineers and scientists carried around a set of marked up wooden sticks in their pocket protector.

If designing and building manual mathematical machines is something that you think really adds up to a good time, check out this post on how to design and build your own circular slide rule!

Continue reading “Genaille’s Rods: When Paint Sticks Do Math”

Procedurally Generating Marble Runs

Marble runs are somehow incredibly soothing to play with and watch, with the gentle clack of the marbles and the smooth, predictable motion. Sadly for some, they never quite got enough time to enjoy them in school. Luckily, [Fernando Jerez] is here with a way to procedurally generate marble runs you can actually play with!

[Fernando] does a great job of explaining the mathematical process of generating the marble runs, using the method of random space filling curves. A maze is drawn on a grid, with points on the grid acting as walls. Each grid cell is then given a value based on points on its corners, and these values then translate into directions of travel. This creates a path through the maze. Scaling this path along the Z-axis, and then replacing the path with a marble track creates the run. It’s then a simple matter of adding a shaft to the loop with a screw to drive marbles back to the top of the run, and you’re all set!

With both animated explanations and actual 3D printed marble runs, [Fernando] demonstrates the concept well. We’d love to print a few runs of our own, and we can’t help but think there’s other great applications for the mathematics behind this concept. If you’re wise to it, drop it in the comments. Otherwise, check out these exquisite creations we’ve featured before!

Simulating Snakes And Ladders For Fun, Not Profit

A great many of you will remember the game of Snakes and Ladders from your youth. It’s a simple game, which one grows to realise involves absolutely no skill – it’s purely the luck of the dice. [Alex Laratro] noticed that without player decisions to effect the outcome, the game was thus a prime candidate for simulation. 

[Alex] wanted to dive into the question of “Who is winning a game of Snakes and Ladders?” at any given point in the gameplay. A common approach would be to state “whoever is in front”, but the ladders might have something to say about that. [Alex] uses Markov analysis to investigate, coming to some interesting conclusions about how the game works, and how this compares to the design of more complex games like Mario Kart and Power Grid.

Overall, it’s a breakdown of a popular game that’s simple enough to really sink your teeth into, but has some incredibly interesting conclusions that are well worth considering for anyone designing their own board games. We love seeing math applied to novel and fun problems – and it can solve important problems, too.