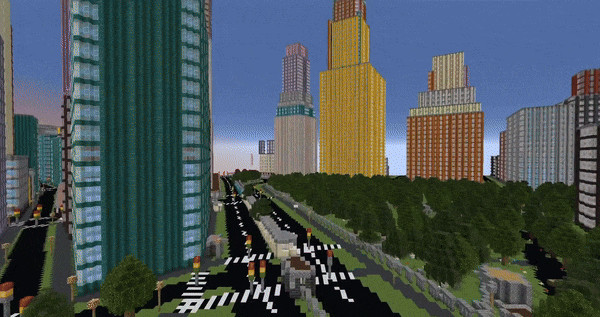
Over the years, dedicated gamers have created incredible recreations of real (and not so real) locations and structures within the confines of Minecraft. Thanks to their efforts, you can explore everything from New York city to Middle Earth and the U.S.S. Enterprise in 1:1: scale.
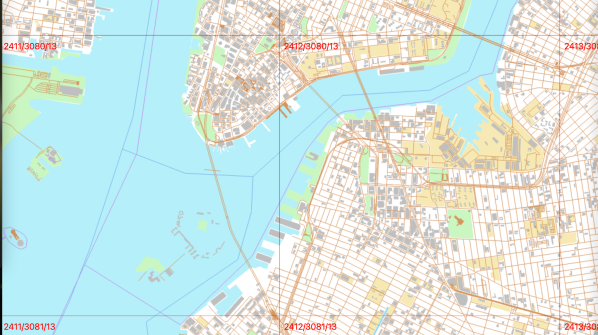
But what if you wanted to recreate your own town, and didn’t have the hundreds of hours of spare time necessary to do it by hand? Enter Arnis, an open source project from [Louis Erbkamm] that can pull in geographic data from OpenStreetMap and turn it into a highly detailed Minecraft map with just a few keystrokes.
 The tool, written in Rust, can be either run via an interactive graphical interface or on the command line. In either case, you provide Arnis with the latitude and longitude for a bounding box around whatever you want to import into the game. [Louis] warns that the resulting process is fairly computationally heavy, so you should start be experimenting with small areas.
Once generated, the map can be loaded into the Java Edition of Minecraft. This refers to the original build of the game that predates the Microsoft buyout. Once Redmond took over they spearheaded a new version of the game written in C++ which was then ported over to mobile operating systems and game consoles. Long story short, if you want to wander around a Minecraft version of your home town, you’ll have to do it on your desktop computer instead of your Nintendo Switch.
While the tool is usable in its current state, [Louis] has a fairly long list of features that either still need to be implemented or could use some improvements. From the number of pull requests that have been merged in, it looks like any assistance the community can provide to make Arnis as capable as possible is welcome, so feel free to lend a hand if you’ve got that geospatial fever.
We’ve seen several examples of hackers bringing objects from Minecraft into the physical world, so it’s refreshing to see a bit of our reality sneaking into the game’s blocky universe.