Machine Learning Does Its Civic Duty By Spotting Roadside Litter

If there’s one thing that never seems to suffer from supply chain problems, it’s litter. It’s everywhere, easy to spot and — you’d think — pick up. Sadly, most of us seem to treat litter as somebody else’s problem, but with something like this machine vision litter mapper, you can at least be part of the solution.

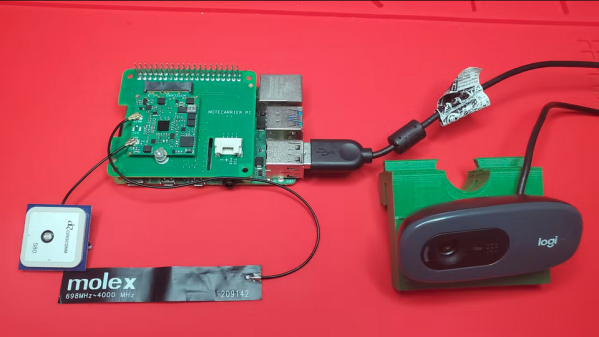
For the civic-minded [Nathaniel Felleke], the litter problem in his native San Diego was getting to be too much. He reasoned that a map of where the trash is located could help municipal crews with cleanup, so he set about building a system to search for trash automatically. Using Edge Impulse and a collection of roadside images captured from a variety of sources, he built a model for recognizing trash. To find the garbage, a webcam with a car window mount captures images while driving, and a Raspberry Pi 4 runs the model and looks for garbage. When roadside litter is found, the Pi uses a Blues Wireless Notecard to send the GPS location of the rubbish to a cloud database via its cellular modem.

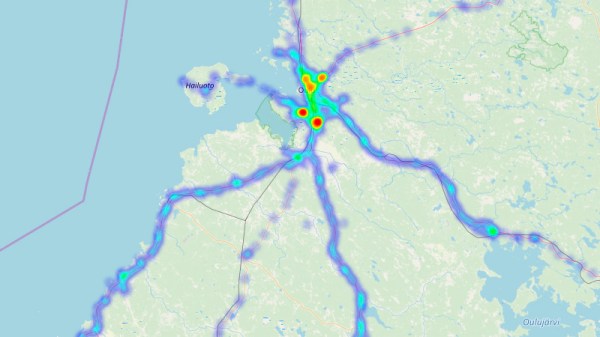
Cruising around the streets of San Diego, [Nathaniel]’s system builds up a database of garbage hotspots. From there, it’s pretty straightforward to pull the data and overlay it on Google Maps to create a heatmap of where the garbage lies. The video below shows his system in action.

Yes, driving around a personal vehicle specifically to spot litter is just adding more waste to the mix, but you’d imagine putting something like this on municipal vehicles that are already driving around cities anyway. Either way, we picked up some neat tips, especially those wireless IoT cards. We’ve seen them used before, but [Nathaniel]’s project gives us a path forward on some ideas we’ve had kicking around for a while.

Continue reading “Machine Learning Does Its Civic Duty By Spotting Roadside Litter”

The Heat Of The Moments – Location Visualization In Python

Have you ever taken a look at all the information that Google has collected about you over all these years? That is, of course, assuming you have a Google account, but that’s quite a given if you own an Android device and have privacy concerns overruled by convenience. And considering that GPS is a pretty standard smartphone feature nowadays, you shouldn’t be surprised that your entire location history is very likely part of the collected data as well. So unless you opted out from an everchanging settings labyrinth in the past, it’s too late now, that data exists — period. Well, we might as well use it for our own benefit then and visualize what we’ve got there.

Location data naturally screams for maps as visualization method, and [luka1199] thought what would be better than an interactive Geo Heatmap written in Python, showing all the hotspots of your life. Built around the Folium library, the script reads the JSON dump of your location history that you can request from Google’s Takeout service, and overlays the resulting heatmap on the OpenStreetMap world map, ready for you to explore in your browser. Being Python, that’s pretty much all there is, which makes [Luka]’s script also a good starting point to play around with Folium and map visualization yourself.

While simply just looking at the map and remembering the places your life has taken you to can be fun on its own, you might also realize some time optimization potential in alternative route plannings, or use it to turn your last road trip route into an art piece. Just, whatever you do, be careful that you don’t accidentally leak the location of some secret military facilities.

[via r/dataisbeautiful]

Opt-Out Fitness Data Sharing Leads To Massive Military Locations Leak

People who exercise with fitness trackers have a digital record of their workouts. They do it for a wide range of reasons, from gathering serious medical data to simply satisfying curiosity. When fitness data includes GPS coordinates, it raises personal privacy concerns. But even with individual data removed, such data was still informative enough to spill the beans on secretive facilities around the world.

Strava is a fitness tracking service that gathers data from several different brands of fitness tracker — think Fitbit. It gives athletes a social media experience built around their fitness data: track progress against personal goals and challenge friends to keep each other fit. As expected of companies with personal data, their privacy policy promised to keep personal data secret. In the same privacy policy, they also reserved the right to use the data shared by users in an “aggregated and de-identified” form, a common practice for social media companies. One such use was to plot the GPS data of all their users in a global heatmap. These visualizations use over 6 trillion data points and can be compiled into a fascinating gallery, but there’s a downside.

This past weekend, [Nathan Ruser] announced on Twitter that Strava’s heatmap also managed to highlight exercise activity by military/intelligence personnel around the world, including some suspected but unannounced facilities. More worryingly, some of the mapped paths imply patrol and supply routes, knowledge security officers would prefer not to be shared with the entire world.

This is an extraordinary blunder which very succinctly illustrates a folly of Internet of Things. Strava’s anonymized data sharing obsfucated individuals, but didn’t manage to do the same for groups of individuals… like the fitness-minded active duty military personnel whose workout habits are clearly defined on these heat maps. The biggest contributor (besides wearing a tracking device in general) to this situation is that the data sharing is enabled by default and must be opted-out:

“You can opt-out of contributing your anonymized public activity data to Strava Metro and the Heatmap by unchecking the box in this section.” —Strava Blog, July 2017

We’ve seen individual fitness trackers hacked and we’ve seen people tracked through controlled domains before, but the global scope of [Nathan]’s discovery puts it in an entirely different class.

[via Washington Post]

Heatmap of vacuum cleaning robot

A Glimpse Into The Mind Of A Robot Vacuum Cleaner

What’s going through the mind of those your autonomous vacuum cleaning robots as they traverse a room? There are different ways to find out such as covering the floor with dirt and seeing what remains afterwards (a less desirable approach) or mounting an LED to the top and taking a long exposure photo. [Saulius] decided to do it by videoing his robot with a fisheye lens from near the ceiling and then making a heatmap of the result. Not being satisfied with just a finished photo, he made a video showing the path taken as the room is being traversed, giving us a glimpse of the algorithm itself.

Looking down on the room and robot

The robot he used was the Vorwerk VR200 which he’d borrowed for testing. In preparation he cleared the room and strategically placed a few obstacles, some of which he knew the robot wouldn’t get between. He started the camera and let the robot do its thing. The resulting video file was then loaded into some quickly written Python code that uses the OpenCV library to do background subtraction, normalizing, grayscaling, and then heatmapping. The individual frames were then rendered into an animated gif and the video which you can see below.

Continue reading “A Glimpse Into The Mind Of A Robot Vacuum Cleaner”

A Look Into The Future Of Slicing

I’ve had a few conversations over the years with people about the future of 3D printing. One of the topics that arises frequently is the slicer, the software that turns a 3D model into paths for a 3D printer. I thought it would be a good idea to visualize what slicing, and by extension 3D printing, could be. I’ve always been a proponent of just building something, but sometimes it’s very easy to keep polishing the solution we have now rather than looking for and imagining the solutions that could be. Many of the things I’ll mention have been worked on or solved in one context or another, but not blended into a cohesive package.

I believe that fused deposition modelling (FDM), which is the cheapest and most common technology, can produce parts superior to other production techniques if treated properly. It should be possible to produce parts that handle forces in unique ways such  that machining, molding, sintering, and other commonly implemented methods will have a hard time competing with in many applications.

Re-envisioning the slicer is no small task, so I’m going to tackle it in three articles. Part One, here, will cover the improvements yet to be had with the 2D and layer height model of slicing. It is the first and most accessible avenue for improvement in slicing technologies. It will require new software to be written but does not dramatically affect the current construction of 3D printers today. It should translate to every printer currently operating without even a firmware change.

Part Two will involve making mechanical changes to the printer: multiple materials, temperatures, and nozzle sizes at least. The slicer will need to work with the printer’s new capabilities to take full advantage of them.

Finally, in Part Three, we’ll consider adding more axes. A five axis 3D printer with advanced software, differing nozzle geometries, and multi material capabilities will be able to produce parts of significantly reduced weight while incorporating internal features exceeding our current composites in many ways. Five axis paths begin to allow for weaving techniques and advanced “grain” in the layers put down by the 3D printer.

Continue reading “A Look Into The Future Of Slicing”