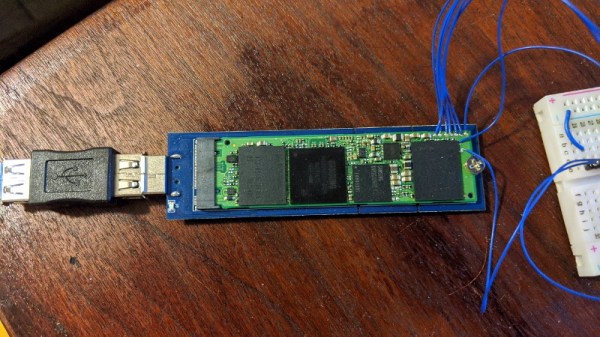
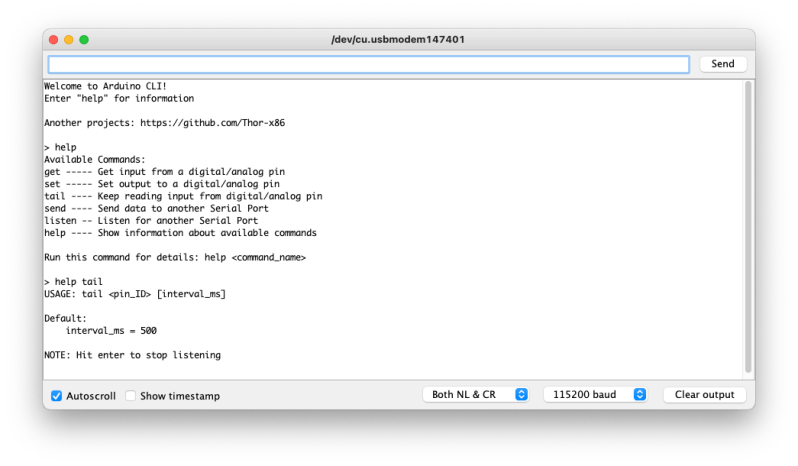
Need to quickly toggle or read some logic signals without the hassle of writing a quick program? [Thor_x86], aka [Eric], built an Arduino sketch that does just that — and he threw in the ability to send (or receive) serial messages, too. This is a neat idea — kind of a simplified Bus Pirate.
We should warn you that this is an early release, and there are a few minor issues which we are sure [Eric] will iron out soon. We discovered the function strtol() was misspelled in cmd_send.cpp, and there are some configuration #defines which need to be sorted out in file parsePin.cpp, depending on which Arduino module you are running. We got it running on an Arduino Leonardo the quickest, because it has support for Serial1().
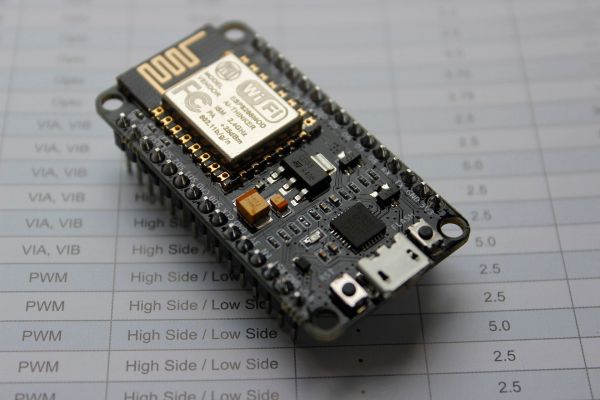
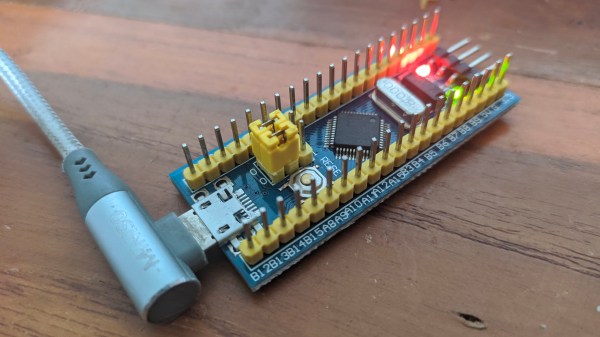
Don’t be discouraged by these glitches in this rev 0 deployment — [Eric] has really made quite a nice tool here. Check his GitHub repository for updates (or submit corrections yourself). All in all, it’s a good addition to your digital tool box. On a completely unrelated note, we really like [Eric]’s USB cable with the right-angle micro connector, grungy though it may be.
Besides the standard tools like Bus Pirate, GreatFET, FTDI modules, etc., are there any similar tools you like to use for bit banging and serial testing? Let us know in the comments below.