Debugging an application crash can oftentimes feel like you’re an intrepid detective in a grimy noir detective story, tasked with figuring out the sordid details behind an ugly crime. Slogging through scarce clues and vapid hints, you find yourself down in the dumps, contemplating the deeper meaning of life and the true nature of man, before hitting that eureka moment and cracking the case. One might say that this makes for a good game idea, and [Jonathan] would agree with that notion, thus creating the Fatal Core Dump game.
Details can be found in the (spoiler-rich) blog post on how the game was conceived and implemented. The premise of the game is that of an inexplicable airlock failure on an asteroid mining station, with you being the engineer tasked to figure out whether it was ‘just a glitch’ or that something more sinister was afoot. Although an RPG-style game was also considered, ultimately that proved to be a massive challenge with RPG Maker, resulting in this more barebones game, making it arguably more realistic.
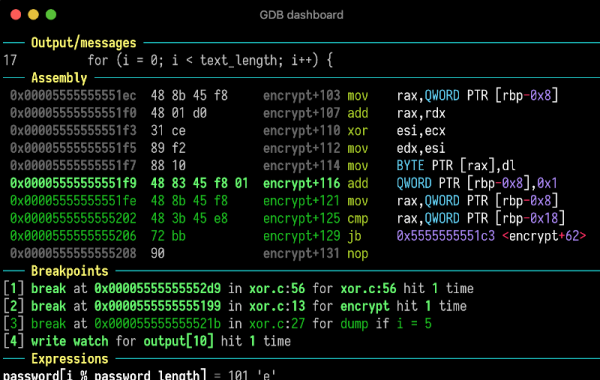
Suffice it to say that this game is not designed to be a cheap copy of real debugging, but the real deal. You’re expected to be very comfortable with C, GDB, core dump analysis, x86_64 ASM, Linux binary runtime details and more. At the end you should be able to tell whether it was just a silly mistake made by an under-caffeinated developer years prior, or a malicious attack that exploited or introduced some weakness in the code.
If you want to have a poke at the code behind the game, perhaps to feel inspired to make your own take on this genre, you can take a look at the GitHub project.