DSP Spreadsheet: Talking To Yourself Using IQ

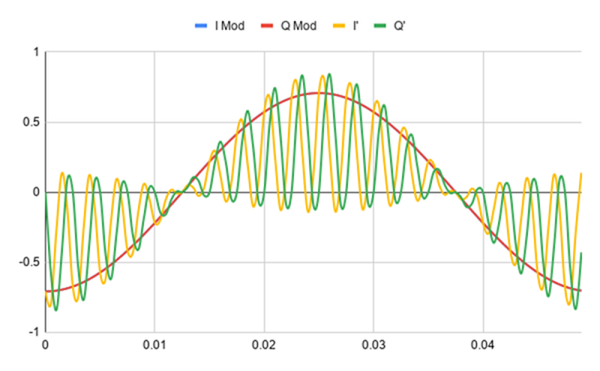
We’ve done quite a bit with Google Sheets and signal processing: we’ve generated signals, created filters, and computed quadrature signals. We can pull all that together into an educational model for two SDRs talking to each other, but it’s going to require two parts: modulation and demodulation. Guess what? We can do that with a spreadsheet.

The first step is to generate a reference clock for the carrier. You’ll need a cosine wave (I) and sine wave (Q). Of course, you also need the time base. That’s columns A-C in the spreadsheet and works like other signal generation we’ve seen.

Continue reading “DSP Spreadsheet: Talking To Yourself Using IQ”

DSP Spreadsheet: IQ Diagrams

In previous installments of DSP Spreadsheet, we’ve looked at generating signals, mixing them, and filtering them. If you start trying to work with DSP, though, you’ll find a topic that always rears its head: IQ signals. It turns out, these aren’t as hard as they appear at first and, as usual, we’ll tackle them in a spreadsheet.

What does IQ stand for? The I stands for “in phase” and the Q stands for quadrature. By convention, the I signal is a cosine wave and the Q signal is a sine wave. Another way to say that is that the I and Q signals are 90 degrees out of phase. By manipulating the amplitude of I and Q, you can create complex modulation or, conversely, demodulate signals. We’ll see a spreadsheet that shows that completely next time.

Continue reading “DSP Spreadsheet: IQ Diagrams”

DSP Spreadsheet: Frequency Mixing

Circuit simulation and software workbooks like Matlab and Jupyter are great for being able to build things without a lot of overhead. But these all have some learning curve and often use clever tricks, abstractions, or library calls to obscure what’s really happening. Sometimes it is clearer to build math models in a spreadsheet.

You might think that spreadsheets aren’t built for doing frequency calculation and visualization but you’re wrong. That’s exactly what they’re made for — performing simple but repetative math and helping make sense of the results.

In this installment of the DSP Spreadsheet series, I’m going to talk about two simple yet fundamental things you’ll need to create mathematical models of signals: generating signals and mixing them. Since it is ubiquitous, I’ll use Google Sheets. Most of these examples will work on any spreadsheet, but at least everyone can share a Google Sheets document. Along the way, we’ll see a neat spreadsheet trick I should probably use more often.

Continue reading “DSP Spreadsheet: Frequency Mixing”

DSP Spreadsheet: FIR Filtering

There’s an old saying: Tell me and I forget, teach me and I may remember, involve me and I learn. I’m guilty of this in a big way — I was never much on classroom learning. But if I build something or write some code, I’m more likely to understand how it works and why.

Circuit simulation and software workbooks like Matlab and Jupyter are great for being able to build things without a lot of overhead. But these all have some learning curve and often use clever tricks, abstractions, or library calls to obscure what’s really happening. Sometimes it is easier to build something in a spreadsheet. In fact, I often do little circuit design spreadsheets or even digital design because it forces me to create a mathematical model which, in turn, helps me understand what’s really going on.

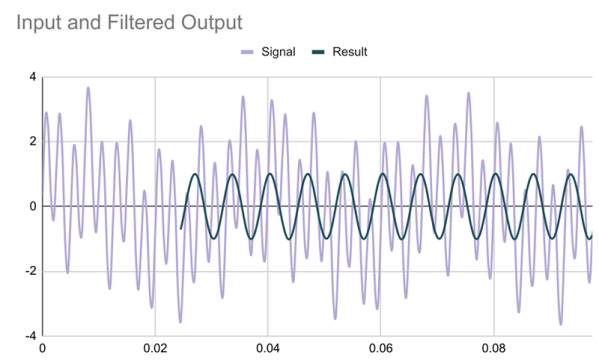
In this article I’m going to use Google Sheets — although you could do the same tricks in just about any spreadsheet — to generate some data and apply a finite impulse response (FIR) filter to it. Of course, if you had a spreadsheet of data from an instrument, this same technique would work, too.

Continue reading “DSP Spreadsheet: FIR Filtering”

Never Mind The Sheet Music, Here’s Spreadsheet Music

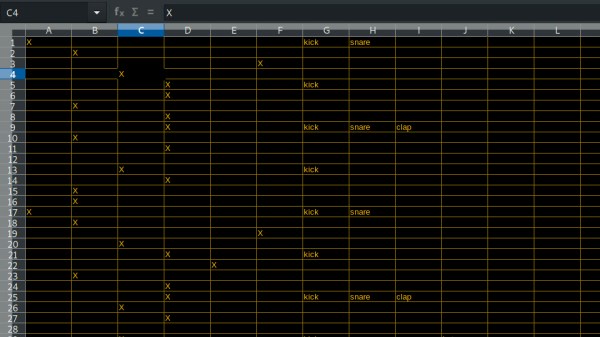
Nothing says Rockstar Musician Lifestyle like spreadsheet software. Okay, we might have mixed up the word order a bit in that sentence, but there’s always Python to add some truth to it. After all, if we look at the basic concept of MIDI sequencers, we essentially have a row of time-interval steps, and depending on the user interface, either virtual or actual columns of pitches or individual instruments. From a purely technical point of view, spreadsheets and the like would do just fine here.

Amused by that idea, [Maxime] wrote a Python sequencer that processes CSV files that works with both hardware and software MIDI synthesizers. Being Python, most of the details are implemented in external modules, which makes the code rather compact and easy to follow, considering it supports both drums and melody tracks in the most common scales. If you want to give it a try, all you need is the python-rtmidi and mido module, and you should be good to go.

However, if spreadsheets aren’t your thing, [Maxime] has also a browser-based sequencer project with integrated synthesizer ongoing, with a previous version of it also available on GitHub. And in case software simply doesn’t work out for you here, and you prefer a more hands-on experience, don’t worry, MIDI sequencers seem like an unfailing resource for inspiration — whether they’re built into an ancient cash register, are made entirely out of wood, or are built from just everything.

Continue reading “Never Mind The Sheet Music, Here’s Spreadsheet Music”

Optimizing The Spread: More Spreadsheet Circuit Design Tricks

Last time I showed you how to set up a reasonably complex design in a spreadsheet: a common emitter bipolar transistor amplifier. Having the design in a spreadsheet makes it easy to do “what if” scenarios and see the effects on the design almost immediately.

Another advantage that spreadsheets offer is a way to “solve” or optimize equations. That can be very useful once you have your model. For Excel, you need to install the Solver add-in (go to the Excel Options dialog, select Manage Add-Ins, and select the Solver Add-In). You might also enjoy OpenSolver. You can even get that for Google Sheets (although it currently lacks a non-linear solver which makes it less useful for what we need).

Continue reading “Optimizing The Spread: More Spreadsheet Circuit Design Tricks”

Circuit Design? Spread The Joy

Accountants and MBAs use spreadsheets to play “what if” scenarios with business and financial data. Can you do the same thing with electronic circuits? The answer–perhaps not surprisingly–is yes.

Consider this simple common emitter amplifier (I modeled it in PartSim, if you’d like to open it):

In this particular case, there are several key design parameters. The beta of the transistor (current gain) is 220. The amplifier has an overall voltage gain of about 3 (30/10). I say about, because unless the transistor is ideal, it won’t be quite that. The supply voltage (Vcc) is 12 volts and I wanted the collector voltage (VC) to idle at 6V to allow the maximum possible positive and negative swing. I wanted the collector current (IC) to be 200mA.

Continue reading “Circuit Design? Spread The Joy”