Shake, Rattle, Roll, With Your Own Seismograph

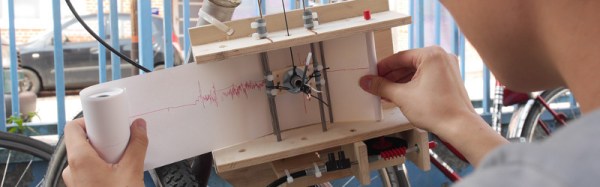
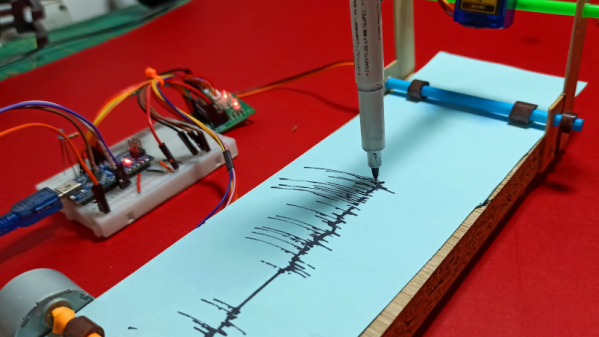
We always love to see projects where you can build your own lab equipment so [CompactDIY’s] homemade seismograph caught our eye. The design uses an Arduino with an accelerometer and builds on one of their earlier projects. You can see a video of the device below.

The principle is simple. A hobby servo controls a pen and a stepper motor rolls paper, creating a makeshift strip recorder. Its software uses the Visuino system, which is a flowchart-like system, but it outputs Arduino code. Honestly, we would probably have just plotted the data on a PC, but there’s a certain charm to the strip recorder and the idea would work for other types of data recording projects, too. We thought if you rearranged the stepper motor and cut a paper disk out, you could also have a circular chart recorder easily, which wouldn’t need to friction transport the paper. A clock motor would make it even less dependent on software, too.

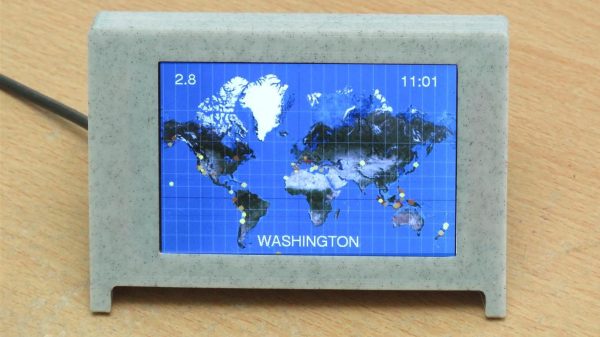
If this project interests you, try a Raspberry shake, which isn’t as delicious as it sounds. Or, keep an eye on the entire globe, if you prefer.

Continue reading “Shake, Rattle, Roll, With Your Own Seismograph”

Watch Earthquake Roll Across A Continent In Seismograph Visualization Video

If your only exposure to seismologists at work is through film and television, you can be forgiven for thinking they still lay out rolls of paper to examine lines of ink under a magnifying glass. The reality is far more interesting in a field that has eagerly adopted all available technology. A dramatic demonstration of modern earthquake data gathering, processing, and visualization was Tweeted by @IRIS_EPO following a central California quake on July 4th, 2019. In this video can see the quake’s energy propagate across the continental United States in multiple waves of varying speed and intensity. The video is embedded below, but click through to the Twitter thread too as it has a lot more explanation.

The acronym IRIS EPO expands out to Incorporated Research Institutions for Seismology, Education and Public Outreach. We agree with their publicity mission; more people need to know how cool modern seismology is. By combining information from thousands of seismometers, we could see forces that we could not see from any individual location. IRIS makes seismic data available to researchers (or curious data science hackers) in a vast historical database or a real time data stream. Data compilations are presented in several different forms, this particular video is a GMV or Ground Motion Visualization. Significant events like the 4th of July earthquake get their own GMV page where we can see additional details, like the fact this visualization compiled data from 2,132 stations.

If this stirred up interest in seismology, you can join in the fun of networked seismic data. A simple seismograph can be built from quite humble components, but of course there are specially designed chips for the task as well.

Continue reading “Watch Earthquake Roll Across A Continent In Seismograph Visualization Video”

Bicycle Seismograph Measures The Streets

Riding the streets of the Netherlands on a bicycle is a silky-smooth experience compared to doing the same on those of Germany. So says [Kati Hyyppä], who made the move with her trusty Dutch bike. The experience led her to record the uneven cobblestones and broken asphalt of the German roads on a home-made seismograph, a paper chart recorder driven by the bike’s motion and recorded upon by a pen free to vibrate as it passed over any bumps.

The resulting instrument is a wooden frame with a ballpoint pen mounted in a sliding holder weighted with some washers and kept under some tension with elastic bands. The paper roll is driven from the motion of the bike by the drive from a mechanical speedometer feeding a set of FischerTechnik gears, and the whole unit is suspended from the crossbar.

You can see it in action in the video below the break, and if you would like to build one yourself she has put the project up on Instructables as well as posting the description linked above.

Continue reading “Bicycle Seismograph Measures The Streets”

Hackaday Links Column Banner

Hackaday Links: July 9, 2023

Good news this week from Mars, where Ingenuity finally managed to check in with its controllers after a long silence. The plucky helicopter went silent just after nailing the landing on its 52nd flight back on April 26, and hasn’t been heard from since. Mission planners speculated that Ingenuity, which needs to link to the Perseverance rover to transmit its data, landed in a place where terrain features were blocking line-of-sight between the two. So they weren’t overly concerned about the blackout, but still, one likes to keep in touch with such an irreplaceable asset. The silence was broken last week when Perseverance finally made it to higher ground, allowing the helicopter to link up and dump the data from the last flight. The goal going forward is to keep Ingenuity moving ahead of the rover, acting as a scout for interesting places to explore, which makes it possible that we’ll see more comms blackouts. Ingenuity may be more than ten-fold over the number of flights that were planned, but that doesn’t mean it’s ready for retirement quite yet.

Continue reading “Hackaday Links: July 9, 2023”

Ask Hackaday: Incidental Earthquake Detection

It never seems to fail: at the very moment that human society seems to reach a new pinnacle of pettiness, selfishness, violence, and self-absorption, Mother Nature comes along and reminds us all who’s really in charge. The obvious case in point here is the massive earthquakes near the border of Turkey and Syria, the appalling loss of life from which is only now becoming evident, and will certainly climb as survivors trapped since the Monday quakes start to succumb to cold and starvation.

Whatever power over nature we think we can wield pales by comparison with the energy released in this quake alone, which was something like 32 petajoules. How much destruction such a release causes depends on many factors, including the type of quake and its depth, plus the soil conditions at the epicenter. But whatever the local effects on the surface, quakes like these have a tendency to set the entire planet ringing like a bell, with seismic waves transmitted across the world that set the needles of professionally maintained seismometers wiggling.

For as valuable as these seismic networks are, though, there’s a looser, ad hoc network of detection instruments that are capable of picking up quakes as large as these from half a planet away. Some are specifically built to detect Earth changes, while some are instruments that only incidentally respond to the shockwaves traveling through the planet. And we want to know if this quake showed up in the data from anyone’s instruments.

Continue reading “Ask Hackaday: Incidental Earthquake Detection”

How The Hunga Tonga Volcano Eruption Was Felt Around The World

On the 14th of January, 2022, the Hunga Tonga-Hunga Ha’apai volcano began a gigantic eruption that would go on to peak in ferocity the next day. The uninhabited island volcano would quickly make headlines as the country of Tonga was cut off the world and tsunamis bore out from the eurption zone.

In a volcanic event of this size, the effects can be felt around the world. With modern instruments, they can be properly understood too. Let’s take a look at how the effects of the Hunga Tonga eruption were captured and measured across the globe.

Continue reading “How The Hunga Tonga Volcano Eruption Was Felt Around The World”

An Earthquake Display To Keep You Abreast Of Rumblings Worldwide

The Internet has brought us the ability to share data all over the globe, and nearly instantaneously at that. It’s revolutionized the sharing of science across the world, and taking advantage of this global data network is this earthquake display from [AndyGadget].

The build relies on an ESP32 fitted with an ILI9486 TFT display. The screen is in color and has a nice 480×320 resolution. This enables it to display a reasonably legible world map using the Web Mercator projection to fit the rectangular screen. The microcontroller then pulls in information from Seismic Portal, a site that aggregates data from seismographs and other sensors scattered all over the world.  Data from the site is pulled into the device live and overlaid on the world map, allowing the viewer to see the location of any current earthquakes at a glance.

It’s a great project, and one that we reckon would make a great addition to any university geology department. If it’s sparked an interest, consider diving deeper into the world of seismic analysis and data yourself!