There are many ways to update an embedded system in the field. Images can fly through the air one a time, travel by sneaker or hitch a ride on other passing data. OK, maybe that’s a stretch, but there are certainly a plethora of ways to get those sweet update bytes into a target system. How are those bytes assembled, and what are the tools that do the assembly? This is the problem I needed to solve.
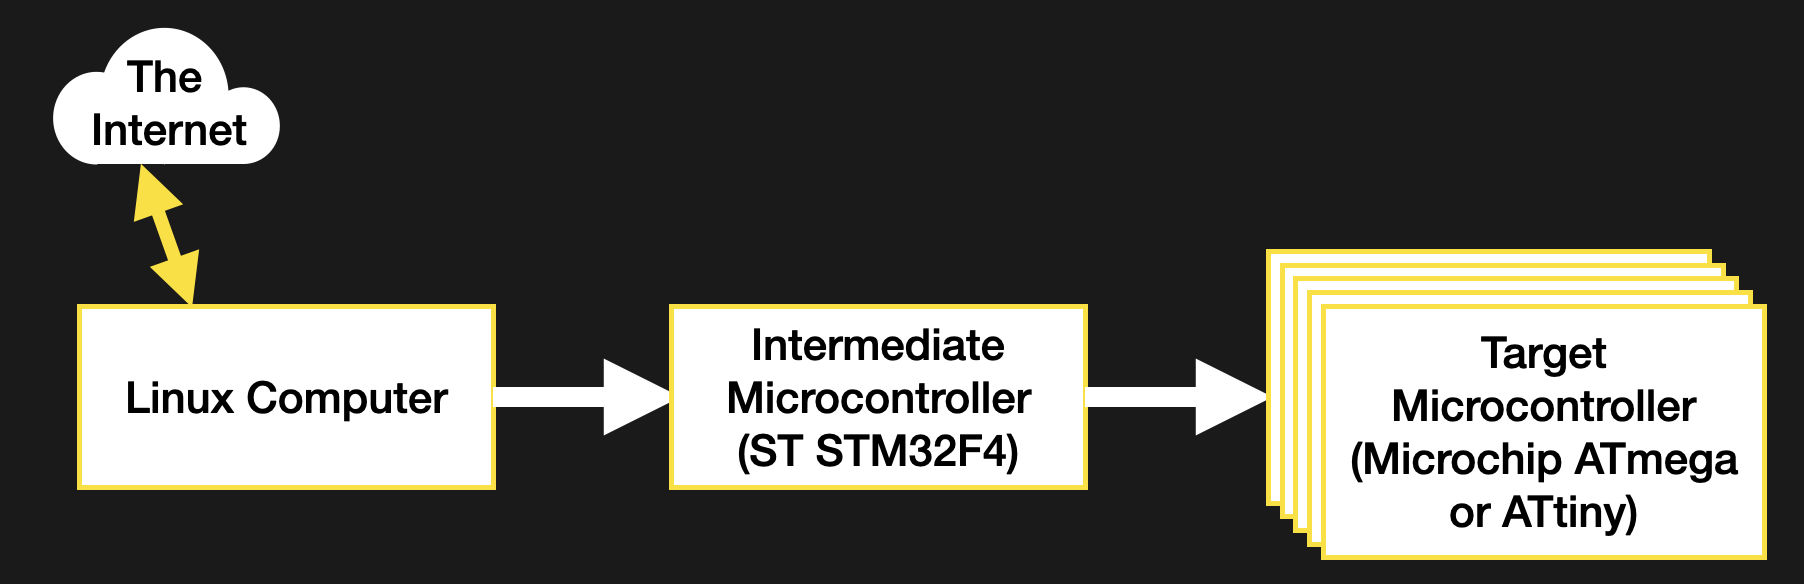
Recall, my system wasn’t a particularly novel one (see the block diagram below). Just a few computers asking each other for an update over some serial busses. I had chosen to bundle the payload firmware images into the binary for the intermediate microcontroller which was to carry out the update process. The additional constraint was that the blending of the three firmware images (one carrier and two payload) needed to happen long after compile time, on a different system with a separate toolchain. There were ultimately two options that fit the bill.


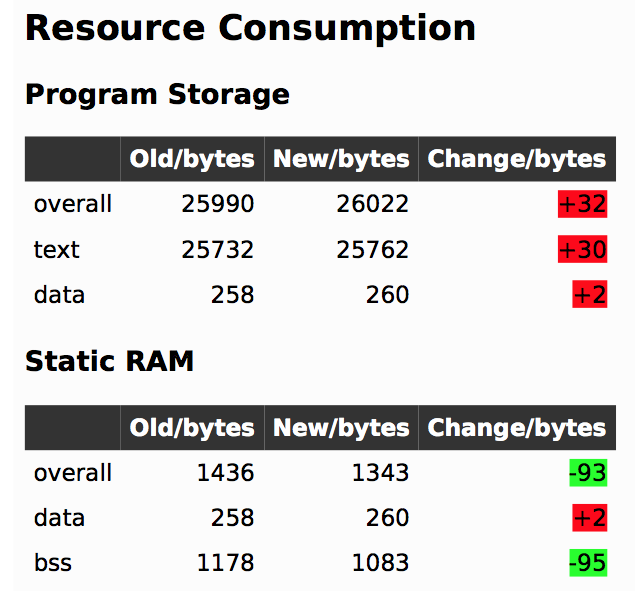 In firmware-land, where flash space can be limited, it’s nice to keep a handle on code size. This can be done a number of ways. Manual inspection of .map files (colloquially “mapfiles”) is the easiest place to start but not conducive to automatic tracking over time. Mapfiles are generated by the linker and track the compiled sizes of object files generated during build, as well as the flash and RAM layouts of the final output files.