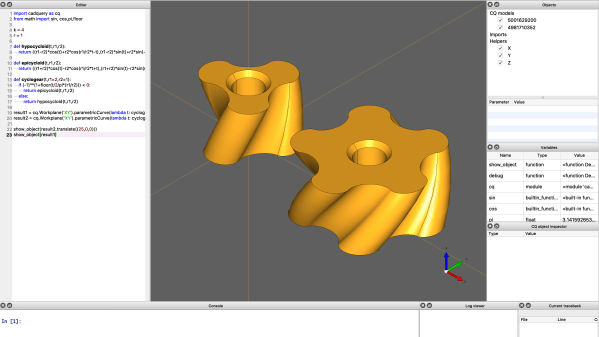
Now, we know what some of you are going to say — “Oh man, not another programmatic CAD tool, what’s wrong with OpenSCAD?” — and you may be right, but maybe hold on a bit and take a look at this one, because we think that it’s now pretty awesome! OpenSCAD is great, we use it all the time round these parts, but it is a bit, you know, weird in places. Then along comes CadQuery, and blows it out of the water ease-of-use and functionality wise. Now, we’ve seen a few mentions of CadQuery over the years, and finally it’s become a full-blown toolset in its own right, complete with a graphical frontend/editor, CQ-editor. No odd dependencies on FreeCAD to be seen! That said, installing FreeCAD is not a bad thing either.
The goal is to have the CadQuery script that produces this object be as close as possible to the English phrase a human would use.
[Maurice-Michel Didelot] owns a Sonos smart speaker, and was lamenting the devices inability (or plain unwillingness) to stream music from online sources without using a subscription service. YouTube Music will work, but being a subscription product there is a monthly fee, which sucks since you can listen to plenty of content on YouTube for free. [Maurice] decided that the way forward was to dig into how the Sonos firmware accesses ‘web radio’ sources, and see if that could be leveraged to stream audio from YouTube via some kind of on-the-fly stream conversion process.
What? No MP4 support for web radio? Curses!
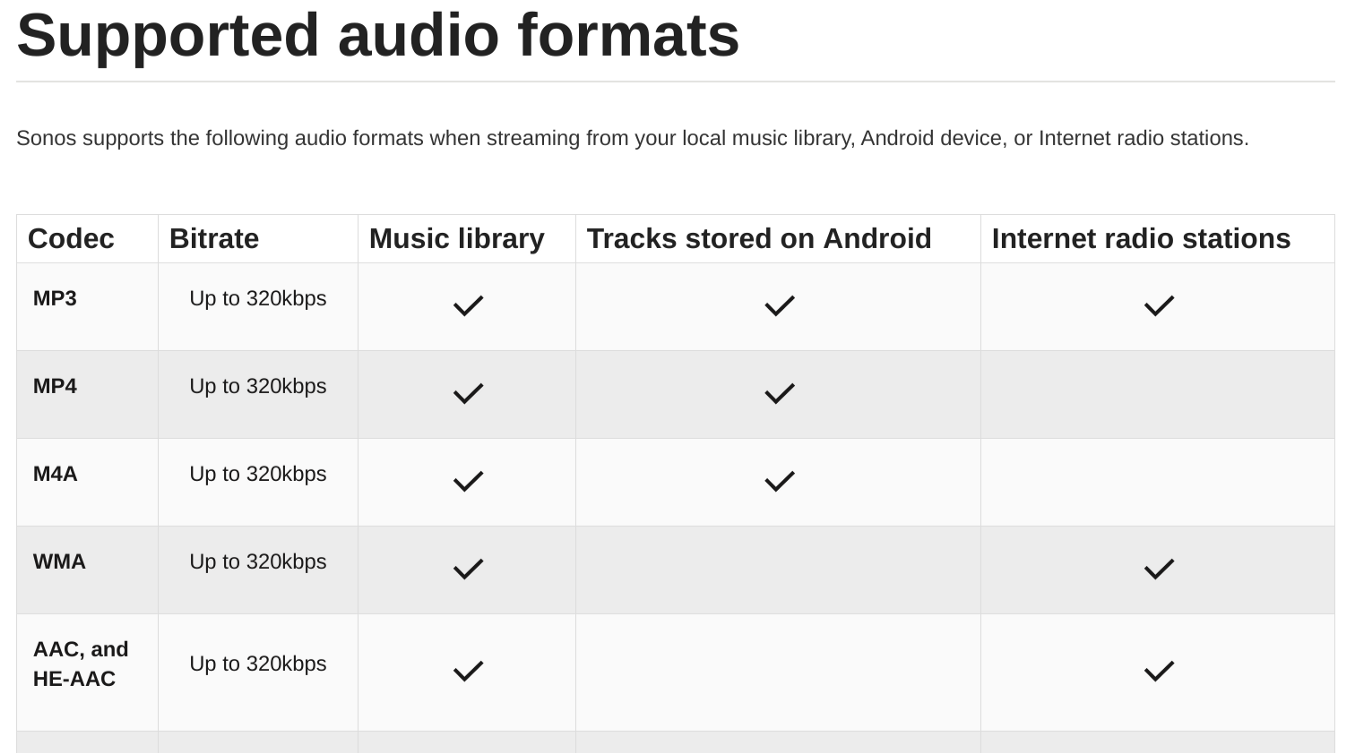
So let’s dig in to how [Maurice] chose to approach this. The smart speaker can be configured to add various streaming audio sources, and allows you add custom sources for those. The Sonos firmware supports a variety of audio codecs, besides MP3, but YouTube uses the MP4 format. Sonos won’t handle that from a web radio source, so what was there to do, but make a custom converter?
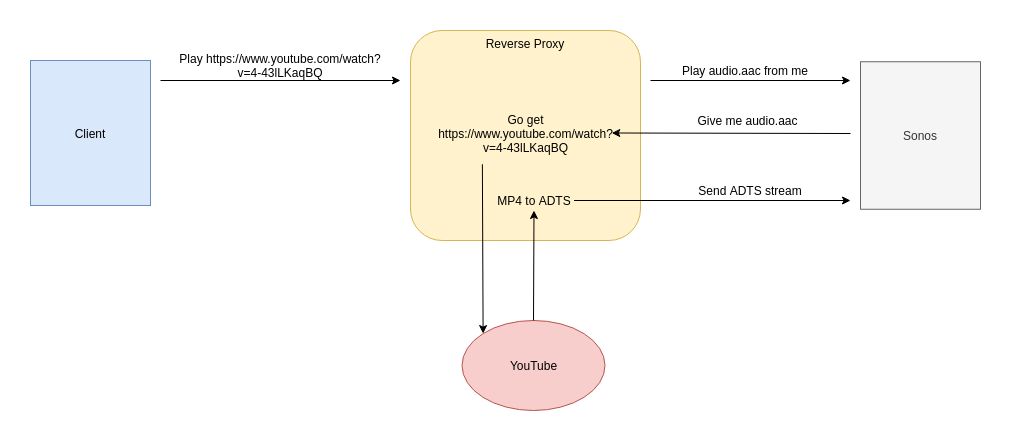
After a little digging, it was determined that Sonos supports AAC encoding (which is how MP4 encodes audio) but needs it wrapped in an ADTS (Audio Data Transport Stream) container. By building a reverse web-proxy application, in python using Flask, it was straightforward enough to grab the YouTube video ID from the web radio request, forward a request to YouTube using a modified version of pytube tweaked to not download the video, but stream it. Pytube enabled [Maurice] to extract the AAC audio ‘atoms’ from the MP4 container, and then wrap them up with ADTS and forward them onto the Sonos device, which happily thinks it’s just a plain old MP3 radio stream, even if it isn’t.
It seems as though more and more of the simple command-line tools and small scripts that used to be bash or small c programs are slowly turning into python programs. Of course, we will just have to wait and see if this ultimately turns out to be a good idea. But in the meantime, next time you’re revamping or writing a new tool, why not spice it up with Rich?
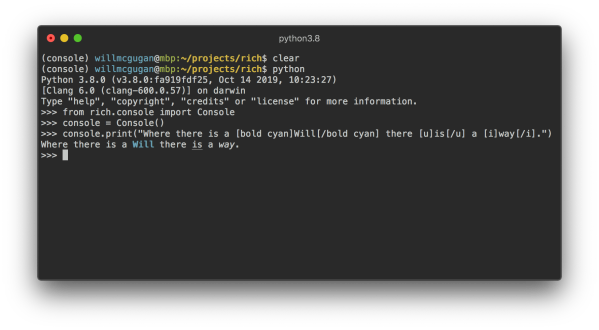
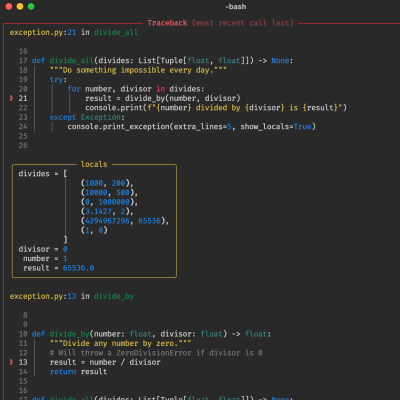
Rich is a python library written by [Will McGugan] that offers text formatting, colors, graphs, progress bars, markdown, syntax highlighting, charts, and more through the power of ANSI codes. The best part is that it works with macOS, Windows, and Linux. In addition, it offers logging solutions that work out of the box. One of the best features of Rich is the inspect functionality. You can pass in an object, and it will use reflection to print a beautiful chart detailing what exactly the object is, helpful in debugging. The other feature is the traceback, which shows a formatted and annotated snapshot of relevant code on the stack during exceptions.
The source itself is well-written python with comments and typing information. There’s a good chance you’ll pick up a trick or two reading through it. Rich is used to build Textual (also by [Will]), which aims to be a GUI API that runs in the terminal. It served as an excellent example of what Rich is capable of. It is incredible how long these protocols have been around. [Will] even ran Rich on a Teletype Model 33. If you’re working with a bit more of a constrained environment, why not bring some color to your Arduino serial terminal?
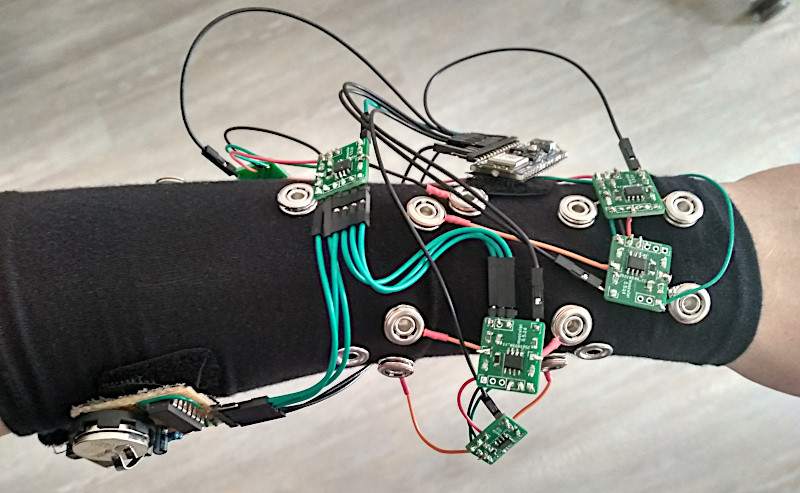
We don’t see many EMG (electromyography) projects, despite how cool the applications can be. This may be because of technical difficulties with seeing the tiny muscular electrical signals amongst the noise, it could be the difficulty of interpreting any signal you do find. Regardless, [hut] has been striving forwards with a stream of prototypes, culminating in the aptly named ‘Prototype 8’
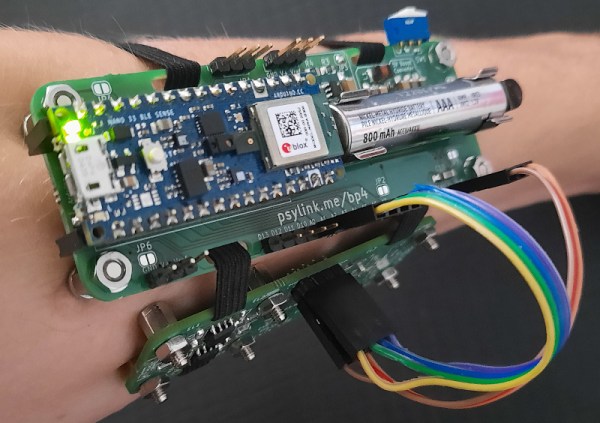
The current prototype uses a main power board hosting an Arduino Nano 33 BLE Sense, as well as a boost converter to pump up the AAA battery to provide 5 volts for the Arduino and a selection of connected EMG amplifier units. The EMG sensor is based around the INA128 instrumentation amplifier, in a pretty straightforward configuration. The EMG samples along with data from the IMU on the Nano 33 BLE Sense, are passed along to a connected PC via Bluetooth, running the PsyLink software stack. This is based on Python, using the BLE-GATT library for BT comms, PynPut handing the PC input devices (to emit keyboard and mouse events) and tensorflow for the machine learning side of things. The idea is to use machine learning from the EMG data to associate with a specific user interface event (such as a keypress) and with a little training, be able to play games on the PC with just hand/arm gestures. IMU data are used to augment this, but in this demo, that’s not totally clear.
An earlier prototype of the PsyLink.
All hardware and software can be found on the project codeberg page, which did make us double-take as to why GnuRadio was being used, but thinking about it, it’s really good for signal processing and visualization. What a good idea!
Obviously there are many other use cases for such a EMG controlled input device, but who doesn’t want to play Mario Kart, you know, for science?
Checkout the demo video (embedded below) and you can see for yourself, just be aware that this is streaming from peertube, so the video might be a little choppy depending on your local peers. Finally, if Mastodon is your cup of tea, here’s the link for that. Earlier projects have attempted to dip into EMG before, like this Bioamp board from Upside Down Labs. Also we dug out an earlier tutorial on the subject by our own [Bil Herd.]
When it comes to electronic design, breadboarding a circuit is the fun part — the creative juices flow, parts come and go, jumpers build into a tangled mess, but it’s all worth it when the circuit finally comes to life. Then comes the “What have I done?” phase, where you’ve got to backtrack through the circuit to document exactly how you built it. If only there was a better way.
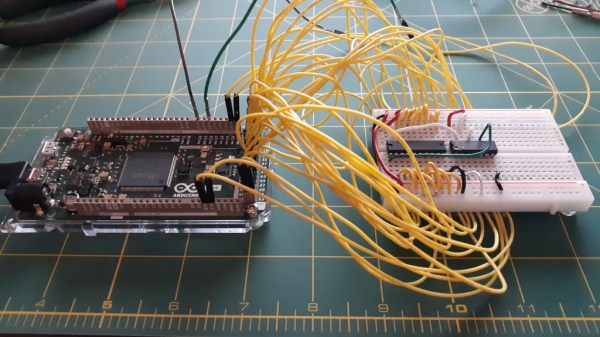
Thanks to [Nick Bild], there is, in the form of the “Schematic-o-matic”, which aims to automate the breadboard documentation process. The trick is using a breadboard where each bus bar is connected to an IO pin on an Arduino Due. A program runs through each point on the breadboard, running a continuity test to see if there’s a jumper connecting them. A Python program then uses the connection list, along with some basic information about where components are plugged into the board, to generate a KiCad schematic.
[Nick] admits the schematics are crude at this point, and that it’s a bit inconvenient to remove some components, like ICs, from the breadboard first to prevent false readings. But this seems like one of those things where getting 80% of the work done automatically and worrying about the rest later is a big win. Plus, we can see a path forward to automatic IC probing, and even measurement of passive components too. But even as it is, it’s a great tool.
Runescape is pushing nearly 21 years old, and while that’s quite a long time for a game to stay active with an engaged userbase, it’s also a long time for people to modify the game in all kinds of colorful ways. For some older games like Team Fortress 2 this means spinning up a bot to ruin servers, but for Runescape the hacks are a little more lighthearted and fun. Like this axe which allows [BigFancyBen] to play Runescape in real life.
This is more of an augmented reality hack which upgrades his normal human interface device from a simple keyboard and mouse to also include this axe. When the axe is manipulated in real life, the in-game axe can be used at the same time. There are a lot of layers to this one but essentially a Switch joycon is connected to the axe to sense motion, which relays the information on axe swings to an API via a Python script. A bot in the game then chops the virtual tree, which is reported back to the API which then reports it back to [BigFancyBen]’s viewscreen which is additionally streamed on Twitch.
While this started off as frustration with the game’s insistence on grinding in order to reach certain objectives, it seems that there are some fun ways of manipulating that game mechanic for the greater good. [BigFancyBen] originally said he would rather go to the gym than “click anymore rooftops” this is quite the start on the full IRLScape world. Don’t forget that it’s equally possible to take this type of build in the opposite direction and control real-world things from inside a video game.
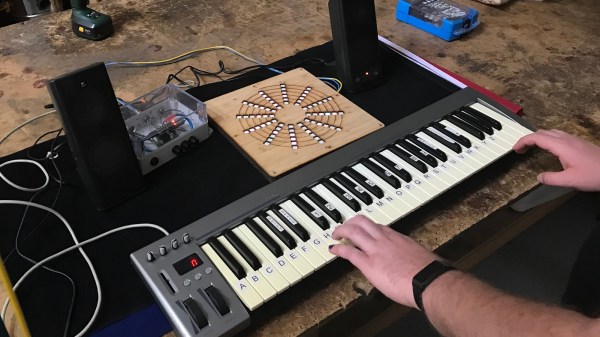
Displaying notes live as they are being played can be a really powerful learning tool, but it’s usually used to learn how to play a specific instrument. This take on the topic is actually a neat way to learn more about music theory — how pitches work together to build the sounds that we hear. The visual tack chosen arranges each of 12 notes into a spiral. As you continue to go up the scale through more octaves, pitches that share the same name line up into a line like a ray projecting out from the sun. So there are 12 rays for the notes in the scale: C, C#/D♭, D, D#/E♭,F, etc.
[mechatronicsguy] built it a few years back but just now got around to documenting it, and we’re sure glad he did. The layout of notes at first looks just like a colorful visualization. But as he mentions in his description, this assigns a shape to each different type of cord. A major cord will have the same shape whether it is played with C, G#, B♭, or any other note as the root. The shape simply rotates around the axis based on that root note. Higher octaves will be shown further out on the radius, but the chord shape will still be the same. Minor, augmented, even modal chords and those with added pitches all have their own unique shape on the display.
You get the best understanding of the visualization by looking at the Python-rendered version in the video below. It’s a nice touch that notes turn grey and fade away after being released so you kind of see where the current chord came from. This isn’t strictly a perk of pre-recordings. While you can feed it MIDI files, you can also play a MIDI instrument and display the visuals live on the hardware version that uses a Teensy with an audio shield.
If you’re looking for examples on how music visualizers are used to teach the instrument, look no further than this Wurlitzer note visualizer replica. Also for those who don’t know, the song being played in the hardware demo (second video below) is Beethoven’s 7th Symphony. Well worth a full listen, it’ll change your life.