An Animated Walkthrough Of How Large Language Models Work

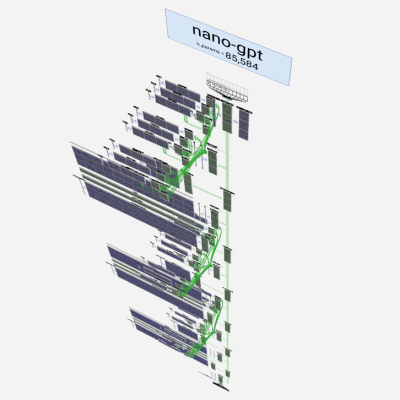
If you wonder how Large Language Models (LLMs) work and aren’t afraid of getting a bit technical, don’t miss [Brendan Bycroft]’s LLM Visualization. It is an interactively-animated step-by-step walk-through of a GPT large language model complete with animated and interactive 3D block diagram of everything going on under the hood. Check it out!

nano-gpt has only around 85,000 parameters, but the operating principles are all the same as for larger models.

The demonstration walks through a simple task and shows every step. The task is this: using the nano-gpt model, take a sequence of six letters and put them into alphabetical order.

A GPT model is a highly complex prediction engine, so the whole process begins with tokenizing the input (breaking up words and assigning numerical values to the chunks) and ends with choosing an appropriate output from a list of probabilities. There are of course many more steps in between, and different ways to adjust the model’s behavior. All of these are made quite clear by [Brendan]’s process breakdown.

We’ve previously covered how LLMs work, explained without math which eschews gritty technical details in favor of focusing on functionality, but it’s also nice to see an approach like this one, which embraces the technical elements of exactly what is going on.

We’ve also seen a much higher-level peek at how a modern AI model like Anthropic’s Claude works when it processes requests, extracting human-understandable concepts that illustrate what’s going on under the hood.

Laser Sound Visualizations Are Not Hard To Make

You might think that visualizing music with lasers would be a complicated and difficult affair. In fact, it’s remarkably simple if you want it to be, and [byte_thrasher] shows us just how easy it can be.

At heart, what you’re trying to do is make a laser trace out waveforms of the music you’re listening to, right? So you just need a way to move the laser’s beam along with the sound waves from whatever you’re listening to. You might be thinking about putting a laser on the head of a servo-operated platform fed movement instructions from a digital music file, but you’d be way over-complicating things. You already have something that moves with the music you play — a speaker!

[byte_thrasher’s] concept is simple. Get a Bluetooth speaker, and stick it in a bowl. Cover the bowl with a flexible membrane, like plastic wrap. Stick a small piece of mirror on the plastic. When you play music with the speaker, the mirror will vibrate and move in turn. All you then have to do is aim a safe laser in a safe direction such that it bounces off the mirror and projects on to a surface. Then, the laser will dance with your tunes, and it’ll probably look pretty cool!

We’ve seen some beautiful laser visual effects before, too. Just be careful and keep your power levels safe and your beams pointing where they should be.

Continue reading “Laser Sound Visualizations Are Not Hard To Make”

Raspberry Pi Pico Becomes Emotionally-Aware Music Visualizer

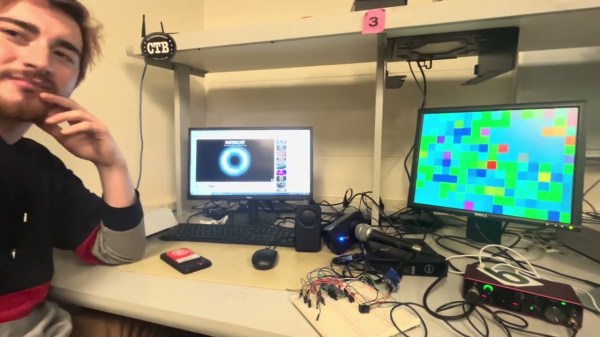
Back in the late 1990s and early 2000s, the nascent world of digital music was incredibly exciting. We all cultivated huge MP3 collections and spent hours staring at the best visualizers Winamp and Windows Media Player had to offer. [Rafael] and [Eric] decided to bring back those glory days with their music visualizer that runs on the Raspberry Pi Pico.

The design is quite interesting, going beyond the usual simplistic display of waveforms and spectrograms. Instead, the Pi Pico uses a Fast Fourier Transform analysis to determine the frequencies of the music, ideally then to determine the key, and thus the mood, of the tune.  Then, the visualizer uses different colors to represent those moods, such as green for happy music in a major key, or deeper blues for a sad piece in a minor key. The output of the visualizer is via Bruce Land’s 8-bit color VGA library, which allows the Pi Pico to drive a monitor directly.

Whether the visualizer really gets the music is up for debate.  The visuals simply don’t look sad and depressing enough when listening to Hallelujah, but maybe that’s just the lack of Jeff Buckley’s vocals in the instrumental. Furthermore, getting an FFT analysis to pull out reliable musical information from an audio recording is finicky to say the least. In any case, the blocky and colorful animations are nice to watch nonetheless. They’d make an excellent basis for visuals at your next underground chiptune show, that much is for certain. Video after the break.

Continue reading “Raspberry Pi Pico Becomes Emotionally-Aware Music Visualizer”

Teensy Spectrum Analyzer Has 170 Channels

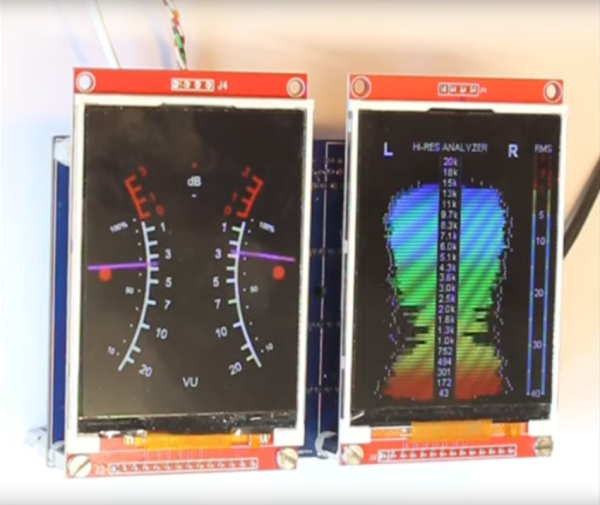
While high-fidelity audio has come a long way in the past several decades, a lot of modern stereo equipment is still missing out on some of the old analog meters that were common on amplifiers and receivers of the 60s through the 80s. Things like VU meters don’t tend to be common anymore, but it is possible to build them back in to your sound system with the help of some microcontrollers. [Mark] shows us exactly how to reclaim some of the old-school functionality with this twin audio visualizer display.

Not only does this build include two displays, but the microcontroller is keeping up with 170 channels in real-time in order to drive the display. What’s more impressive is that it’s being done all on a Teensy 4.1. To help manage all of the data and keep the speed as fast as possible it uses external RAM soldered to the board, and a second Teensy audio board is used to do the real time FFT analysis. Most of the channels are sent to the display hosting the spectrum analyzer but two are reserved for left and right stereo VU meters on the second display.

The project from [Mark] is originally based on this software from [DIYLAB] so everything is open-source. While it was originally built for a specific piece of hardware, [Mark] has it set up with a line in and line out plus a microphone input so it can be used for virtually any audio hardware now. For another take on the classic VU meter, take a look at this design based on an Arudino instead.

Continue reading “Teensy Spectrum Analyzer Has 170 Channels”

Doodlestation Is Beautifully Musical Furniture

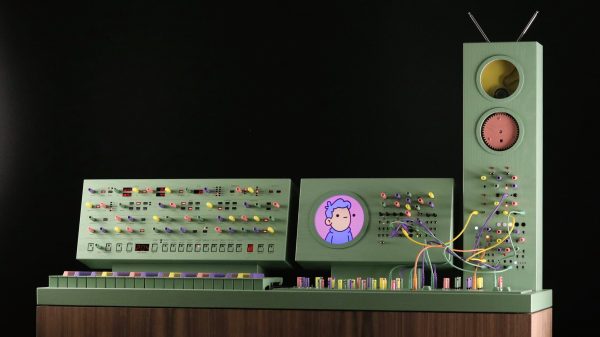
Whether you’re a modular synth enthusiast or simply love the idea of rad electronic jams, we can all get behind the idea of crazy electronic instruments with buttons, dials, and patch cables galore. The Doodlestation is a wonderful example of that, built by [Love Hulten].

There’s a custom 37-key keyboard that lets one input musical notes in the typical way, along with a hilarious animated MIDI visualizer with a man that uses his mouth to shoot rainbows. There’s a theremin built into the chassis, too, allowing your hands to control the sound via the magic of the æther. Even better, there’s a custom-built tape echo in the upright section, and you even get to see the mechanical parts working and the mag ribbon wiggling about. That’s fun.

The custom hardware is joined by a series of off-the-shelf devices that add their own functionality to the mix. It includes a Sequential OB-6 analog synthesizer, a Moog DFAM drum module, and a Hologram Microcosm loop & glitch box for more noodling possibilities.

We love a good musical project around these parts; we’ve featured some great other projects for live electronic jams before, too. Video after the break.

Continue reading “Doodlestation Is Beautifully Musical Furniture”

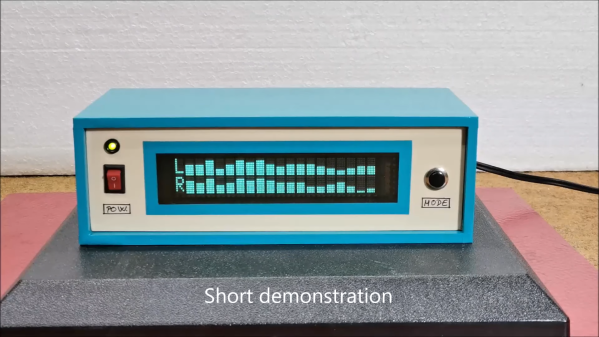
Character VFD Becomes Spectrum Analyzer

These days, streaming services are a great way to listen to music or podcasts on your computer or on the go. However, they lack one feature of the MP3 players and streamers of old: visualizations! [mircemk] is a fan of those, and has built a hardware spectrum analyzer that pumps with the music.

The build relies on a 20×2 character VFD display that looks great, with high brightness and excellent contrast. It can be easily driven from a microcontroller, as it has a controller on board compatible with the typical HD44780 command set. On Arduino platforms, this means the display can easily be driven with the popular LiquidCrystal library.

The Arduino Nano inside takes in the audio signal via its analog inputs. It then processes the audio with the fix_fft library, which runs a Fast Fourier Transform in order to figure out the energy level of each frequency bin in the audio spectrum for both the left and right channels. This data is then sent to the screen for display. It’s impressively fast and smooth, with the display dancing along with the beat nicely as [mircemk] tests it out with some tunes.

If it looks familiar, it’s because it’s an updated version of a prior project from [mircemk]. We saw it previously as a VU meter that pulsed with the beat, an altogether simpler visualization but still a cool one. Video after the break.

Continue reading “Character VFD Becomes Spectrum Analyzer”

Artist operating artistic visualizer with MIDI keyboard

Synth And Visualizer Combo Has Retrocomputing Vibe

[Love Hultén]’s latest piece of interactive art is the SYNTH#BOI, a super-clean build with something of the semi-cyberdeck, semi-vintage computing vibe to it. The device is a combination synthesizer and visualizer, with a 15-inch display, MIDI keyboard, and based on an Intel NUC i5 small form factor PC.

There are not many details about the internal workings of the device, but the high quality of the build is very evident. Photos show a fantastic-looking enclosure with clean lines and sharp finish; it’s a reminder that careful measuring and attention to detail can be the difference between something that looks like a hack job, and something that looks like a finished product.

Watch the SYNTH#BOI in action in the video, embedded below. And if the name [Love Hultén] seems familiar, it’s probably because we featured his VOC-25 “Pink Denture Synth”, a concept instrument with a decidedly memorable design of its own.

Continue reading “Synth And Visualizer Combo Has Retrocomputing Vibe”