Seeing Fireworks In A Different Light

If you’re worried that [Roman Dvořák]’s spectroscopic analysis of fireworks is going to ruin New Year’s Eve or the Fourth of July, relax — the science of this build only adds to the fun.

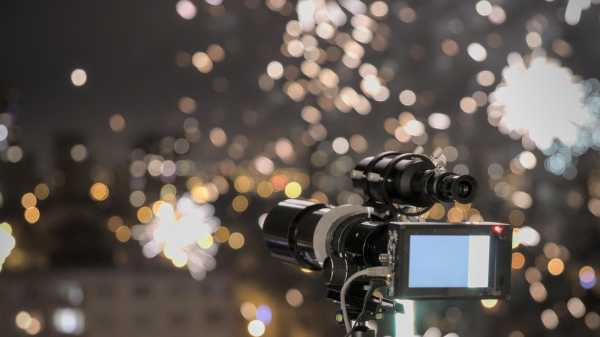
Not that there’s nothing to worry about with fireworks, of course; there are plenty of nasty chemicals in there, and we can say from first-hand experience that getting hit in the face and chest with shrapnel from a shell is an unpleasant experience. [Roman]’s goal with this experiment is pretty simple: to see if it’s possible to cobble together a spectrograph to identify the elements that light up the sky during a pyrotechnic display. The camera rig was mainly assembled from readily available gear, including a Chronos monochrome high-speed camera and a 500-mm telescopic lens. A 100 line/mm grating was attached between the lens and the camera, a finding scope was attached, and the whole thing went onto a sturdy tripod.

From a perch above Prague on New Year’s Eve, [Roman] collected a ton of images in RAW12 format. The files were converted to TIFFs by a Python script and converted to video by FFmpeg. Frames with good spectra were selected for analysis using a Jupyter Notebook project. Spectra were selected by moving the cursor across the image using slider controls, converting pixel positions into wavelengths.

There are some optical improvements [Roman] would like to make, especially in aiming and focusing the camera; as he says, the dynamic and unpredictable nature of fireworks makes them difficult to photograph. As for identifying elements in the spectra, that’s on the to-do list until he can find a library of spectra to use. Or, there’s always DIY Raman spectroscopy. Continue reading “Seeing Fireworks In A Different Light”

The Dipole Antenna Isn’t As Simple As It Appears

Dipole antennas are easy, right? Just follow the formula, cut two pieces of wire, attach your feedline, and you’re on the air.  But then again, maybe not. You’re always advised to cut the legs a little long so you can trim to the right length, but why? Shouldn’t the math just be right? And what difference does wire choice make on the antenna’s characteristics? The simple dipole isn’t really that simple at all.

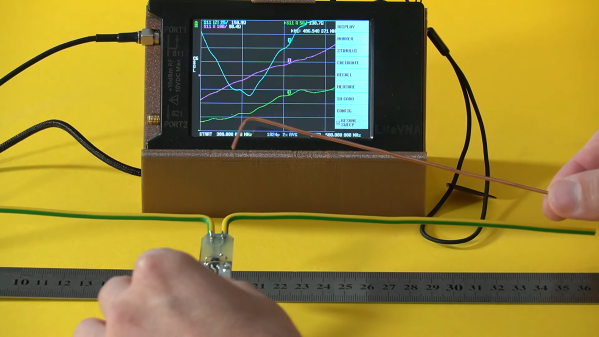
If you’ve got antenna questions, check out [FesZ]’s new video on resonant dipoles, which is a deep dive into some of the mysteries of the humble dipole. In true [FesZ] fashion, he starts with simulations of various dipole configurations ranging from the ideal case — a lossless conductor in free space with as close to zero diameter conductors as the MMANA antenna simulator can support — and gradually build up to more practical designs. Continue reading “The Dipole Antenna Isn’t As Simple As It Appears”

Identify That Antenna By Sight

It’s a skill that radio amateurs pick up over years but which it sometimes comes as a surprise to find that is not shared by everyone, the ability to casually glance at an antenna on a mast or a rooftop and guess what it might be used for. By which of course I mean not some intuitive ability to mentally decode radio signals from thin air, but most of us can look at a given antenna and immediately glean a lot of information about its frequency and performance. Is this privileged knowledge handed down from the Elmers at the secret ceremony of conferring a radio amateur’s licence upon a baby ham? Not at all, in fact stick around, and I’ll share some of the tricks. Continue reading “Identify That Antenna By Sight”

Vintage Monochromator Makes Monochromatic Light, Mechanically

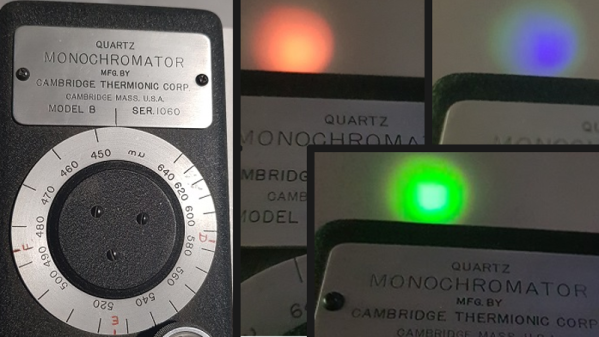
A monochromator is an optical instrument that permits only a narrow selection of wavelengths to be transmitted from a source, and the particular model [Doug] obtained renders visual light monochromatic by way of a mechanically-adjusted system of mirrors and diffraction gratings that allows only the selected wavelength to pass. The big dial is how the operator selects the desired wavelength, and is labeled in ‘mu’ (or milli-micro), but [Doug] helpfully points out the more modern term for that is nanometers.

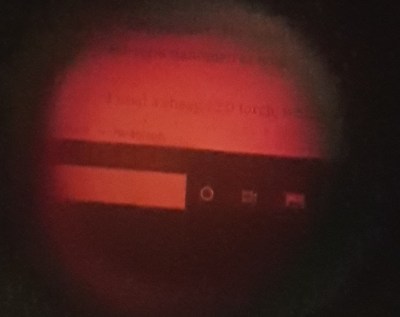
LCD monitor viewed through a monochromator set to pass red wavelength only, showing that images remain intact.

How does it work? Light enters the device via an opening at the base, and only the selected wavelength exits from the top. The dial’s range is from 450 nm to 640 nm (representing violet-blue to red), which [Doug] demonstrates by shining a white LED flashlight into the unit and showing how only green, red, or blue will exit from the top depending on the setting of the dial.

An interesting side note is that with this particular device, images can be rendered monochromatic but otherwise remain intact. [Doug] demonstrates this by viewing a small section of his LCD monitor through the device, as shown in the photo he managed to capture.

It’s an interesting piece of vintage equipment that shows what is possible with passive optical components and a clever mechanical design. These devices are therefore entirely manually-operated tools (at least until someone sticks a stepper motor to the adjustment dial to create an automated scanner, that is.)

Measure Laser Wavelength With A CD And A Tape Measure

Obviously the wavelength of a laser can’t be measured with a scale as large as that of a carpenter’s tape measure. At least not directly and that’s where a Compact Disc comes in. [Styropyro] uses a CD as a diffraction grating which results in an optical pattern large enough to measure.

A diffraction grating splits a beam of light up into multiple beams whose position is determined by both the wavelength of the light and the properties of the grating. Since we don’t know the properties of the grating (the CD) to start, [Styropyro] uses a green laser as reference. This works for a couple of reasons; the green laser’s properties don’t change with heat and it’s wavelength is already known.

It’s all about the triangles. Well, really it’s all about the math and the math is all about the triangles. For those that don’t rock out on special characters [Styropyro] does a great job of not only explaining what each symbol stands for, but applying it (on camera in video below) to the control experiment. Measure the sides of the triangle, then use simple trigonometry to determine the slit distance of the CD. This was the one missing datum that he turns around and uses to measure and determine his unknown laser wavelength.

Continue reading “Measure Laser Wavelength With A CD And A Tape Measure”

Creating A Scanning Monochromator

If you need a specific wavelength of light for research purposes, the naïve way of obtaining that is a white source light, a prism, and a small slit that will move across your own personal Dark Side of the Moon album cover. This is actually a terrible idea; not only won’t you have a reference of exactly what wavelength of light you’re letting through the optical slit, the prism itself will absorb more of one wavelength of light than others.

The solution is a monochromator, a device that performs the same feat of research without all the drawbacks. [Shahriar] got his hands on an old manual monochromator and decided to turn it into a device that performs automatic scans.

The key of a monochromator is a diffraction grating, a mirrored surface with many fine parallel grooves arranged in a step pattern. Because of the surface of the diffraction grating, it’s possible to separate light according to its spectrum much like a prism. Unlike a prism, it’s effectively a first surface mirror meaning all wavelengths of light are reflected more or less equally.

By adding a stepper motor to the dial of his monochromator, [Shahriar] was able to automatically scan across the entire range of the device. Inside the monochromator is a photomultiplier tube that samples the incoming light and turns it into a voltage. By sampling this voltage and plotting it with MATLAB, [Shahriar] was able to plot the intensity of every wavelength of light within the range of the device. It’s all expertly explained in the video below.

Continue reading “Creating A Scanning Monochromator”