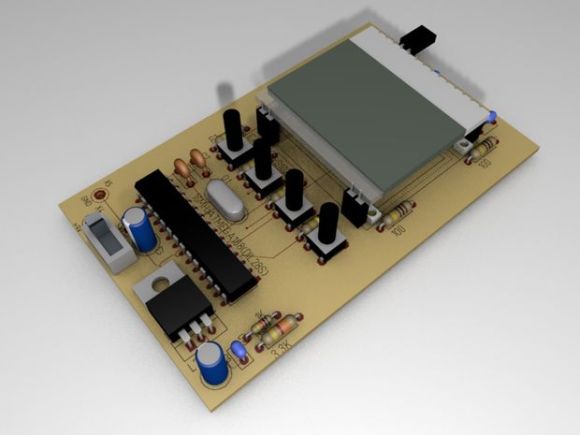
One of the best feature of the ESP8266 is its ability to self-host a web server, allowing for fairly complicated user interactions. The dEEbugger by [S-March] is a nifty little ESP8266 based device with a plethora of features in a small package.
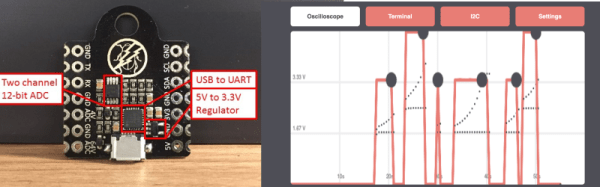
The USB-powered device has a web user interface that enables it to be used as a low-bandwidth oscilloscope, I2C terminal, or UART terminal. As a scope, you may connect to it via your tablet and then use it as a remote voltage monitor. There is a peak detection feature which is a nice touch and gives the entire project a premium feel.
The serial terminal on an ESP8266 is not something new yet it is helpful in disconnecting the console window from the bench. The I2C terminal is where the device really shines as it can scan for connected devices on the connected bus. This Bus-Pirate like feature is useful for beginners as the software can scan the registers addresses of the devices as well.
[S-March] has made the schematic in PDF format as well as the entire code for the project available on GitHub so go right ahead and make it your own. We have had an ESP8266 based VT Terminal device in the past and merging the two would make for an excellent maker tool.
Thanks for the tip [René Arts]

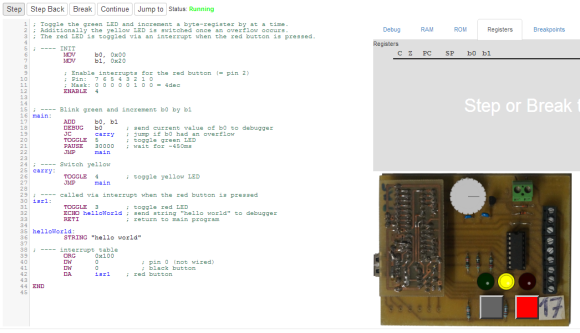 Very few people know assembly. [Luto] seeks to make learning assembly just a little bit easier with his “fully functional