
For the last few months, I had been using Sparkfun’s Phant server as a data logger for a small science project. Unfortunately, they’ve had some serious technical issues and have discontinued the service. Phant was good while it lasted: it was easy to use, free, and allowed me to download the data in a CSV format. It shared data with analog.io, which at the time was a good solution for data visualization.
While I could continue using Phant since it is an open-source project and Sparkfun kindly releases the source code for the server on Github, I thought it might be better to do some research, see what’s out there. I decided to write a minimal implementation for each platform as an interesting way to get a feel for each. To that end, I connected a DHT11 temperature/humidity sensor to a NodeMCU board to act as a simple data source.
Continue reading “Review: IoT Data Logging Services With MQTT”




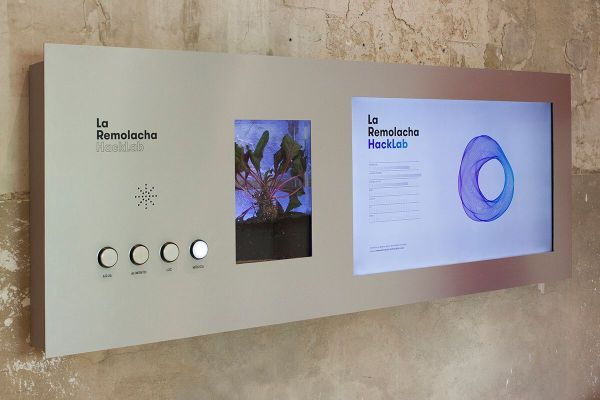
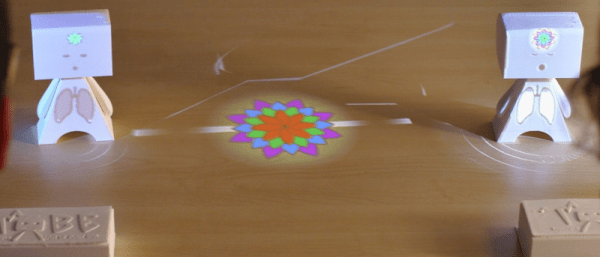
 s to the sensors. The higher the temperature, the more folds in the shape. More distortions appear when there’s more humidity in the soil, while rotation speed increases with air humidity. Adding food increases the size of the visualization, and music triggers more vibrations.