Exostiv FPGA Debugging Might Be A Bargain

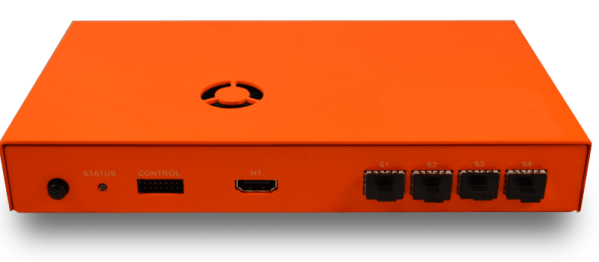
Got $4,000 to spend? Even if you don’t, keep reading — especially if you develop with FPGAs. Exostiv’s FPGA debugging setup costs around $4K although if you are in need of debugging a complex FPGA design and your time has any value, that might not be very expensive. Then again, most of us have a lot of trouble justifying a $4,000 piece of test gear. But we wanted to think about what Exostiv is doing and why we don’t see more of it. Traditionally, debugging FPGAs meant using JTAG and possibly some custom blocks that act like a logic analyzer and chew up real estate on your device. Exostiv also uses some of your device, but instead of building a JTAG-communicating logic analyzer it… well, here’s what their website says:

EXOSTIV IP uses the MGTs (Multi-Gigabit Transceivers) to flow captured data out of the FPGA to an external memory. EXOSTIV IP supports repeating captures of up to 32,768 internal nodes simultaneously at the FPGA’s speed of operation (16 data sets x 2,048 bits).

EXOSTIV IP provides dynamic multiplexer controls to capture even more data sets without the need to recompile. Dynamic ON/OFF controls of data sets let you select the data set and preserve the MGT’s bandwidth for when deeper captures of a reduced set of data is required.

In a nutshell, this means they use high-speed communications to send raw data to a box that has memory and connects back to a PC. That means they can store more data, have more data come out of the chip over a certain time frame, and do sophisticated processing. You can see a video about the device below, and there are more detailed videos on their channel, as well.

Continue reading “Exostiv FPGA Debugging Might Be A Bargain” →
Stepping Up Your Python Printf Debugging Game

Debuggers come in all shapes and sizes, offering a variety of options to track down your software problems and inspecting internal states at any given time. Yet some developers have a hard time breaking the habit of simply adding print statements into their code instead, performing manual work their tools could do for them. We say, to each their own — the best tools won’t be of much help if they are out of your comfort zone or work against your natural flow. Sometimes, a retrospective analysis using your custom-tailored debug output is just what you need to tackle an issue.

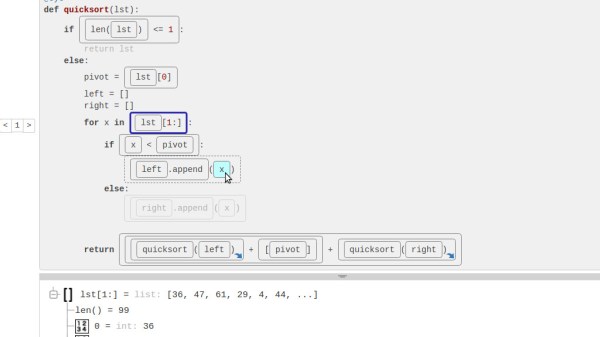
If the last part sounds familiar and your language of choice happens to be Python, [Alex Hall] created the Bird’s Eye Python debugger that records every expression inside a function and displays them interactively in a web browser. Every result, both partial and completed, and every value can then be inspected at any point inside each individual function call, turning this debugger into an educational tool along the way.

With a little bit of tweaking, the web interface can be made remote accessible, and for example, analyze code running on a Raspberry Pi. However, taking it further and using Bird’s Eye with MicroPython or CircuitPython would require more than just a little bit of tweaking, assuming there will be enough memory for it. Although it wouldn’t be first time that someone got creative and ran Python on a memory limited microcontroller.

When You Need A Scope, You Need A Scope

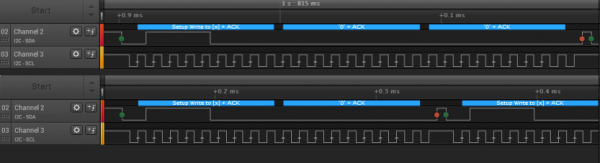
Sometimes there’s just no substitute for the right diagnostic tool. [Ankit] was trying to port some I2C code from an Arduino platform to an ARM chip. When the latter code wasn’t working, he got clever and wrote a small sketch for the Arduino which would echo each byte that came across I2C out to the serial line. The bytes all looked right, yet the OLED still wasn’t working.

Time to bring out the right tool for the job: a logic analyzer or oscilloscope. Once he did that, the problem was obvious (see banner image — Arduino on top, ARM on bottom): he misunderstood what the ARM code was doing and was accidentally sending an I2C stop/start signal between two bytes. With that figured, he was on the right track in no time.

We just ran an epic post on troubleshooting I2C, and we’ll absolutely attest to the utility of having a scope or logic analyzer on hand when debugging communications. If you suspect that the bits aren’t going where they’re supposed to, there’s one way to find out. It’s conceivable that [Ankit] could have dug his way through the AVR’s hardware I2C peripheral documentation and managed to find the status codes that would have also given him the same insight, but it’s often the case that putting a scope on it is the quick and easy way out.

What Could Go Wrong? I2C Edition

I should really like I2C more than I do. In principle, it’s a brilliant protocol, and in comparison to asynchronous serial and SPI, it’s very well defined and clearly standardized. On paper, up to 127 devices can be connected together using just two wires (and ground). There’s an allowance for multiple clock-masters on the same bus, and a way for slaves to signal that the master needs to wait. It sounds perfect.

In reality, the tradeoff for using only two wires is a significantly complicated signalling and addressing system that brings both pitfalls and opportunities for debugging. Although I2C does reduce the number of signal wires you need, it gets dangerous when you have more than a handful of devices on the same pair of wires, and you’re lucky when they all conform to the same standard. I’ve never seen twenty devices on a bus, much less 127.

But still, I2C has its place. I2C was designed to connect up a bunch of slower, cheaper devices without using a lot of copper real estate compared to its closest rival protocol: SPI. If you need to connect a few cheap temperature sensors to a microcontroller (and their bus addresses don’t clash) I2C is a great choice. So here’s a guide to making it work when it’s not working.

Continue reading “What Could Go Wrong? I2C Edition” →

What Could Go Wrong: SPI

Serial Peripheral Interface (SPI) is not really a protocol, but more of a general idea. It’s the bare-minimum way to transfer a lot of data between two chips as quickly as possible, and for that reason alone, it’s one of my favorites. But that doesn’t mean that everything is hugs and daffodils. Even despite SPI’s simplicity, there are still a few ways that things can go wrong.

In the previous article in this series, inspired by actual reader questions, I looked into troubleshooting asynchronous serial connections. Now that you’ve got that working, it’s time to step up to debugging your SPI bus! After a brief overview of the system, we’ll get into how to diagnose SPI, and how to fix it.

Continue reading “What Could Go Wrong: SPI” →

Don’t Tempt The Demo Gods

Including a live technical demonstration as part of a presentation is a lot like walking a tightrope without a net. Which isn’t to say that we don’t do it — we just keep our fingers crossed and bring our lucky horseshoe. The demo gods have smote [Quinn] a mighty blow, in front of a class at Stanford, no less.

IMG_1873-600x448

[Quinn]’s scratch-built computer, Veronica, failed to boot in front of a hall of eager students. When the pressure was off, in the comfort of her own lab, [Quinn] got to debugging. You should read her blog post if you’re at all interested in retrocomputing or troubleshooting of low-level hardware bugs. But if you just can’t spare the five minutes for a pleasant read, here’s a spoiler: watch out for flaky card-edge connectors. All’s well that ends well, with a game of pong.

We’ve been following Veronica from her very first clock cycles, so we’re happy to see her back on her feet again. Good job, [Quinn]!

Squash Your ESP-8266 Bugs With ESP-gdbstub

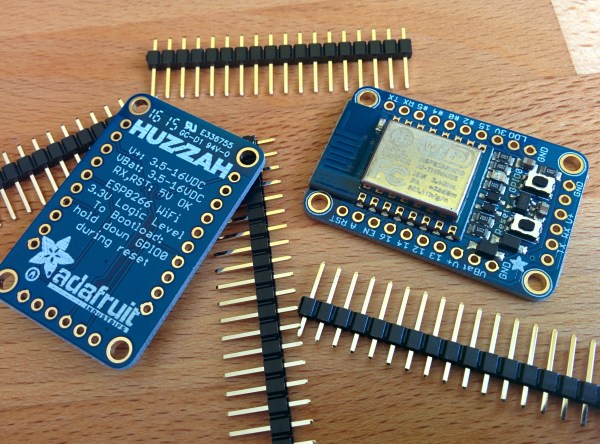
We hope we’re not insulting you by suggesting this, but it’s possible that even the best among us may be faced with bugs in our embedded code from time to time. And while we’re great fans of printf debugging over the serial port, and its high-speed equivalent — flipping a GPIO pin — there’s a time when your bug is so deep that having a real debugger is the best way to dig it out.

[slaff] has been doing some great work documenting C/C++ programming on the ESP-8266, mostly using Eclipse and some of the Arduino libraries. In the fourth part of his series of posts, he walks through using a couple debugger options for the ESP. What makes this all work is the ESP-gdbstub code from Espressif themselves. gdbstub looks great — it works both with the standard SDK as well as with FreeRTOS, so you can debug your ESP-8266 code whether it’s in an OS or on the bare metal. And all this just using the standard serial connection that’s used for programming.

Now, this still may not help with timing-related bugs. ESP-gdbstub uses the serial port, after all. But having the ability to set breakpoints and interactively inspect what’s going on in the chip’s memory is priceless, and doing so with no extra hardware connections is brilliant.

Continue reading “Squash Your ESP-8266 Bugs With ESP-gdbstub” →