We’ve made it through another trip around the sun, and for the first time in what feels like far too long, it seems like things went pretty well for the hackers and makers of the world. Like so many, our community suffered through a rough couple of years: from the part shortages that made building even the simplest of devices more expensive and difficult than it should have been, to the COVID-mandated social distancing that robbed us of our favorite meetups. But when looking back on the last twelve months, most of the news was refreshingly positive.
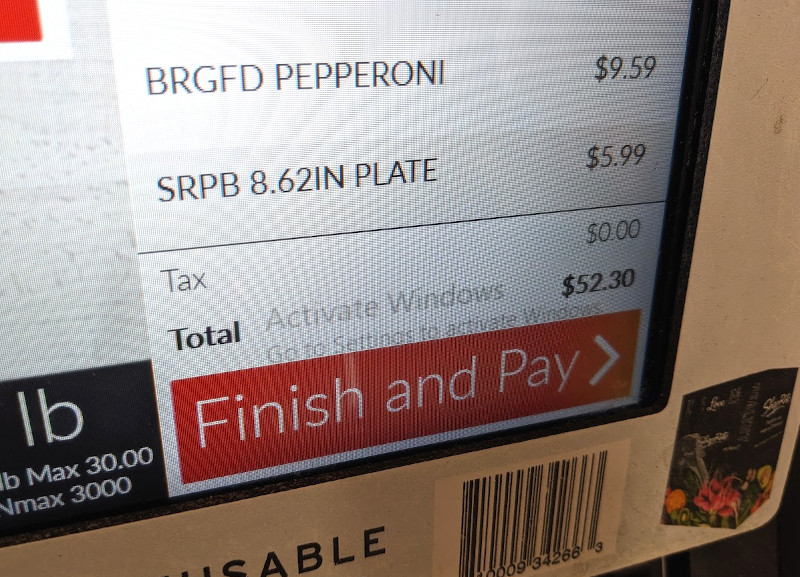
Oh sure, a trip to to the grocery store can lead to a minor existential crisis at the register, but there’s not much we at Hackaday can do about that other than recommend you some good hydroponics projects to help get your own home farm up and running.
As has become our New Year tradition, we like to take this time to go over some of the biggest stories and trends that we picked up on from our unique vantage point. Some will be obvious, but there’s always a few that sneak up on us. These posts tend to make for interesting reading in the future, and if you’ve got the time, we’d recommend going back and reading the previous entries in this series and reminiscing a bit.
It’s also a good time to reflect on Hackaday itself — how we’ve grown, the things that have changed, and perhaps what we can do better going forward. Believe it or not we do read all of the feedback from the community, whether it’s in the comments of individual posts or sent into us directly. We couldn’t do this without readers like you, so please drop us a line and let us know what you’re thinking.
So before we get any farther into 2024, let’s wind back the clock and revisit some of the highlights from the previous year.