No matter how advanced your design skills, the chances are you’ll need to spend some time chasing bugs in your boards after they come back from the assembly house. Testing and debugging a PCB typically involves a lot of cross-checking between the board, the layout and the schematic, which quickly becomes tiresome even for mildly complex designs. To make this task a bit easier, [Ishan Chatterjee] and colleagues at the University of Washington have designed the Augmented Reality Debugging Workbench, or ARDW for short.
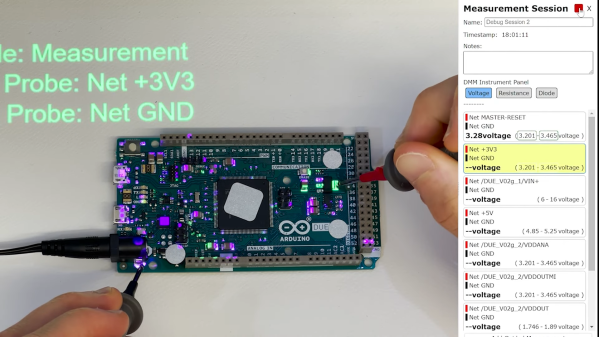
The ARDW is a setup consisting of a lab workbench with an antistatic mat, a selection of measurement instruments and a PC. You can simply place your board on the bench, open the schematic and layout in KiCAD and start measuring and debugging your design as you normally would, but the real magic happens when you select a new icon in KiCAD that exports the schematic and layout to the ARDW system. From that moment, you can select components in your schematic and have them highlighted not only on the layout, but on the physical board in front of you as well. This is perhaps best demonstrated visually, as the team members do in the video embedded below.
The real-life highlighting of components is achieved thanks to a set of cameras that track the motion of everything on the desk as well as a video projector that overlays information on top of the PCB. All of this enables a variety of useful debugging features: for example, there’s an option to highlight pin one on all components, enabling a simple visual check of each component’s orientation. You can select all Do Not Populate (DNP) instances and immediately see if all highlighted pads are empty. If you’re not sure which component you’re looking at, just point at it with your multimeter probe and it’s highlighted on the schematic and layout. You can even place your probes on a net and automatically log the voltage for future reference, thanks to a digital link between the multimeter and the ARDW software.
In addition to designing and building the ARDW, the team also performed a usability study using a group of human test subjects. They especially liked the ability to quickly locate components on crowded boards, but found the on-line measurement system a bit cumbersome due to its limited positional accuracy. Future work will therefore focus on improving the resolution of the projected image and generally making the system more compact and robust. All software is freely available on the project’s GitHub page, and while the current system looks a little complex for hobbyist use, we can already imagine it being a useful tool in production environments.
It’s not even the first time augmented reality has been used for PCB debugging: we saw a somewhat similar system at the 2019 Hackaday Superconference. AR can also come in handy during the design and prototyping phase, as demonstrated by this AR breadboard.
Continue reading “Augmented Reality Workbench Helps You To Debug Your Boards”
 The ORBTrace platform has plenty of untapped potential. There’s