If you’re into amateur rocketry, you pretty quickly outgrow the dinky little Estes motors that they sell in the toy stores. Many hobbyists move on to building their own homebrew solid rocket motors and experimenting with propellant mixtures, but it’s difficult to know if you’re on the right track unless you have a way to quantify the thrust you’re getting. [ElementalMaker] decided he’d finally hit the point where he needed to put together a low-cost test stand for his motors, and luckily for us decided to document the process and the results.
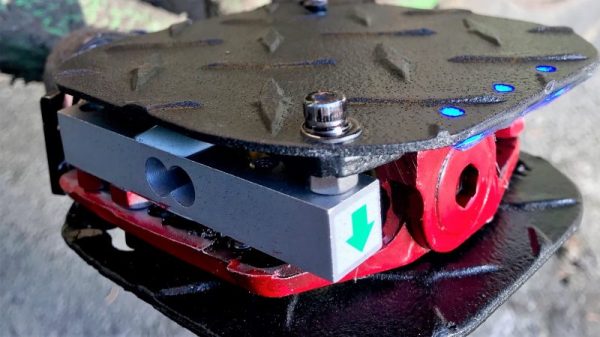
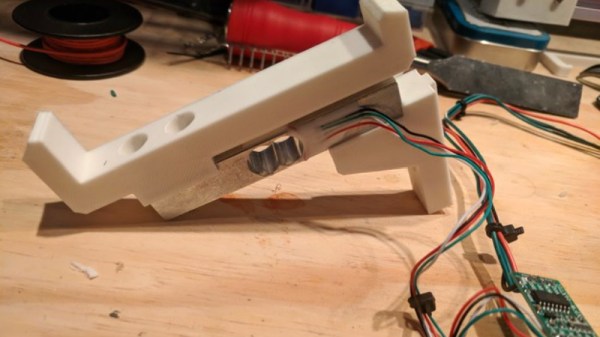
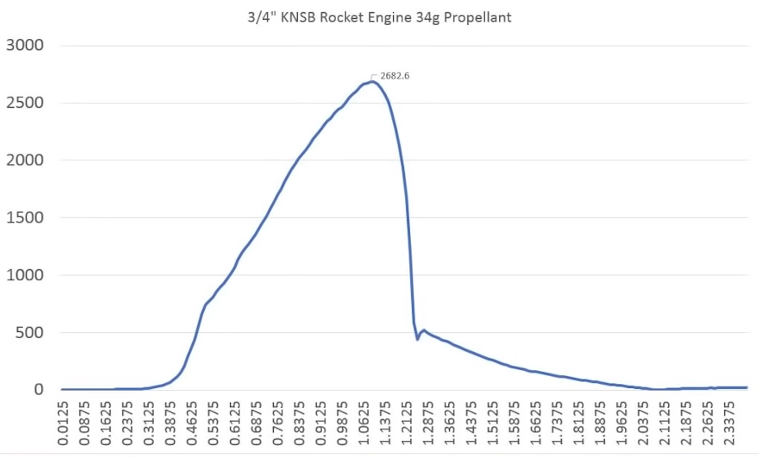 The heart of the stand is a common load cell (the sort of thing you’d find in a digital scale) coupled with a HX711 amplifier board mounted between two plates, with a small section of vertical PVC pipe attached to the topmost plate to serve as a motor mount. This configuration is capable of measuring up to 10 kilograms with an 80Hz sample rate, which is critically important as these type of rocket motors only burn for a few seconds to begin with. The sensor produces hundreds of data points during the short duration of the burn, which is perfect for graphing the motor’s thrust curve over time.
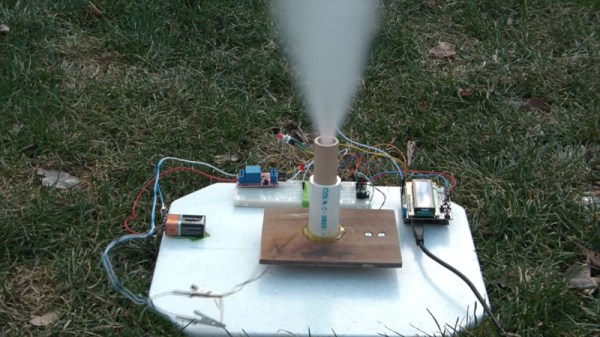
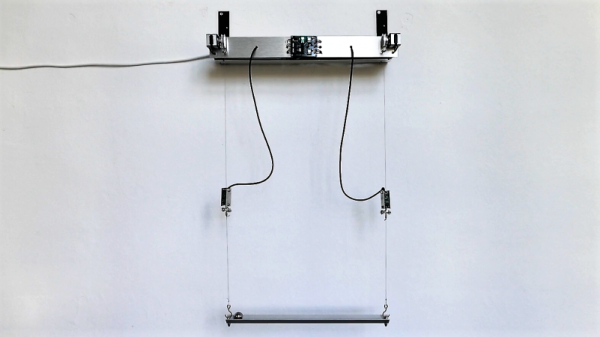
Given such a small window in which to make measurements, [ElementalMaker] didn’t want to leave anything to chance. So rather than manually igniting the motor and triggering the data collection, the stand’s onboard Arduino does both automatically. Pressing the red button on the stand starts a countdown procedure complete with flashing LED, after which a relay is used to energize a nichrome wire “electronic match” stuck inside the motor.
In the video after the break you can see that [ElementalMaker] initially had some trouble getting the Arduino to fire off the igniter, and eventually tracked the issue down to an overabundance of current that was blowing the nichrome wire too fast. Swapping out the big lead acid battery he was originally using with a simple 9V battery solved the problem, and afterwards his first test burns on the stand were complete successes.
If model rockets are your kind of thing, we’ve got plenty of content here to keep you busy. In the past we’ve covered building your own solid rocket motors as well as the electronic igniters to fire them off, and even a wireless test stand that lets you get a bit farther from the action at T-0.


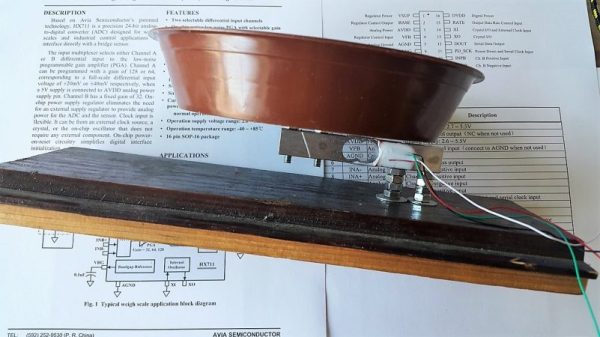
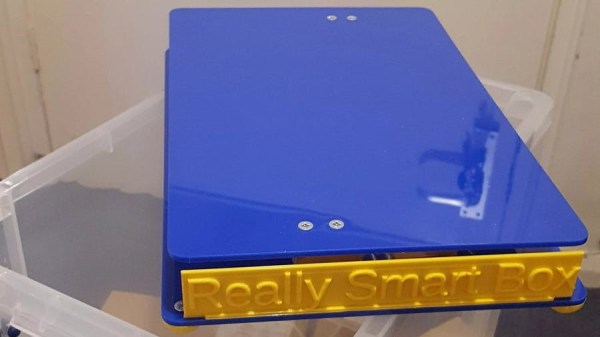
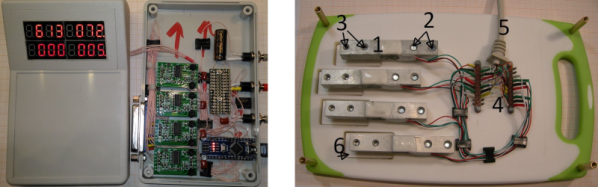
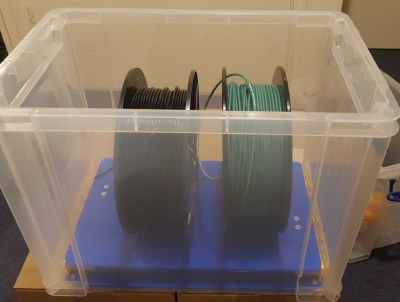 It does this by measuring the weight of the stuff piled on top of it, while also monitoring temperature and humidity. The platform communicates this information wirelessly to a back end, allowing decisions to be made about stock levels, usage, and monitoring of storage conditions. It’s clearly best applied to consumables or other stock that comes and goes. The Really Smart Box platform is battery-powered, but spends most of its time asleep to maximize battery life. The prototype uses the SigFox IoT framework for the wireless data, which we have seen before in a