In our experience, there’s rarely any question when the cat uses the litter box. At all. In the entire house. For hours. And while it may be instantly obvious to the most casual observer that it’s time to clean the thing out, that doesn’t mean there’s no value in quantifying your feline friend’s noxious vapors. For science.
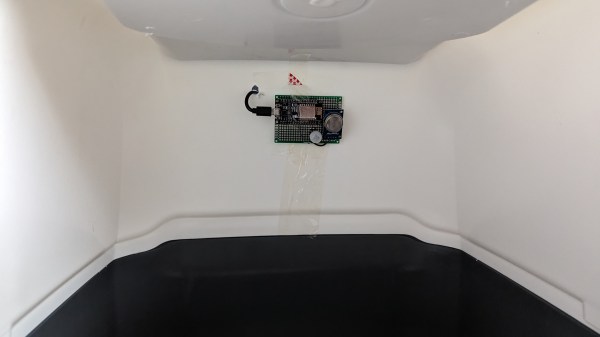
Now of course, [Owen Ashurst] could have opted for one of those fancy automated litter boxes, the kind that detects when a cat has made a deposit and uses various methods to sweep it away and prepare the box for the next use, with varying degrees of success. These machines seem like great ideas, and generally work pretty well out of the box, but — well, let’s just say that a value-engineered system can only last so long under extreme conditions. So a plain old-fashioned litterbox suffices for [Owen], except with a few special modifications. A NodeMCU lives inside the modesty cover of the box, along with a PIR sensor to detect the cat’s presence, as well as an MQ135 air quality sensor to monitor for gasses. It seems an appropriate choice, since the sensor responds to ammonia and sulfides — both likely to be present after a deposit. Continue reading “Litter Box Sensor Lets You Know Exactly What The Cat’s Been Up To”



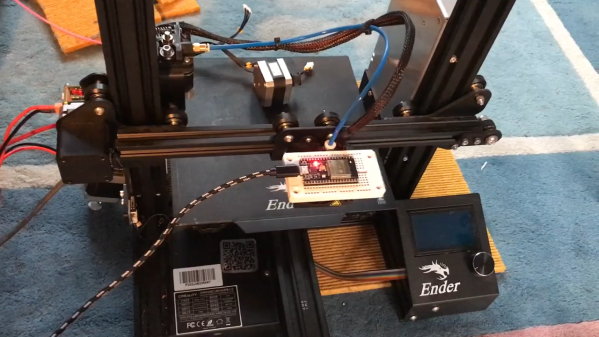
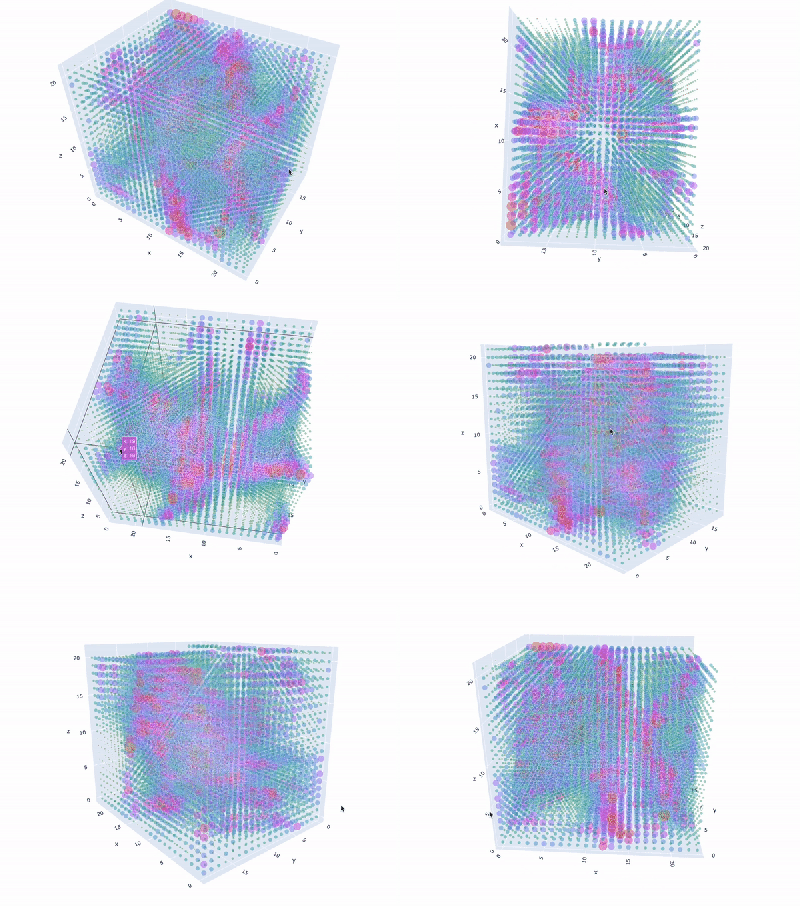 Granted, based as it is on the gantry of an old 3D printer, [Neumi]’s WiFi scanner has a somewhat limited work envelope. A NodeMCU ESP32 module rides where the printer’s extruder normally resides, and scans through a series of points one centimeter apart. A received signal strength indicator (RSSI) reading is taken from the NodeMCU’s WiFi at each point, and the position and RSSI data for each point are saved to a CSV file. A couple of Python programs then digest the raw data to produce both 2D and 3D scans. The 3D scans are the most revealing — you can actually see a 12.5-cm spacing of signal strength, which corresponds to the wavelength of 2.4-GHz WiFi. The video below shows the data capture process and some of the visualizations.