Atopile Wants You To Code Schematics

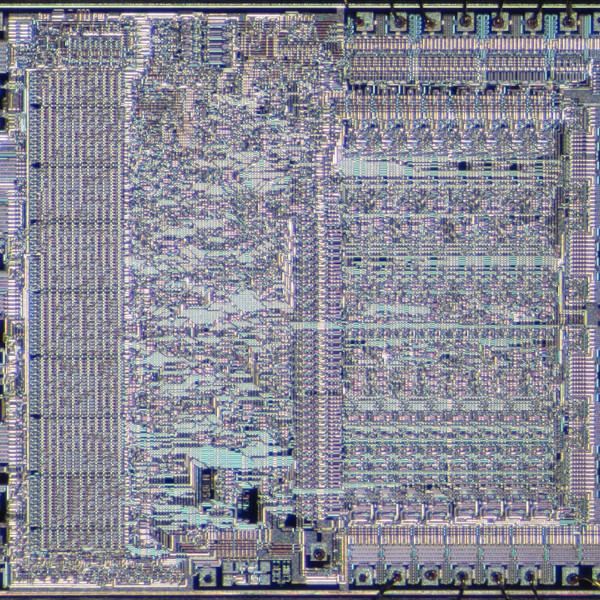
We’d wager that, if you’re reading Hackaday, you’ve looked at more than a few circuit diagrams in your day. Maybe you’ve even converted a few of them over to a PCB. It’s a workflow that, at this point, is well-understood. But as designs become more complex, the schematics are harder to create and maintain. That’s why Atopile wants to treat hardware design more like writing code.

We can see some real benefits to this but also some possible drawbacks. On the plus side, reusing chunks of PCB description should be easy. On the other hand, detecting certain errors on a schematic or PCB layout is easier than spotting them in code. Of course, there are probably types of errors that are easier to catch in code, too, so maybe that’s not a problem. Certainly, if you can spit out a schematic from your code, you could — potentially — have the best of both worlds.

Continue reading “Atopile Wants You To Code Schematics”

Need A Serial Data Plotter? Better Write Your Own

When you’re working with a development team, especially in a supporting capacity, you can often find yourself having to invent tools and support systems that are fairly involved, but don’t add to the system’s functionality. Still, without them, it’d be a dead duck. [Aidan Chandra] was clearly in a similar situation, working with a bunch of postgrads at Stanford, on an exoskeleton project, and needed an accurate data plotter to watch measurements in real-time.

This particular problem has been solved many times over, but [Aidan] laments that many solutions available seem to be too complex, hard to extend, or just have broken dependencies. This happens a lot, and it simply leads to yet another project to get going, before you can do the real work it supports. Based on Python and PyQT5, serial-plotter is a new beginning, with an emphasis on correct data acquisition and real-time data visualization with a little processing thrown in. Think, acquire data, show the raw values as well as the mean value, and RMS noise all on the same windows side-by-side, all of which is easily tweakable with a bit of programming using Numpy and Matplotlib.

One particularly important point to highlight is that of the handling of time-stamping. [Aidan] needed to ensure samples were logged together with a local MCU timestamp so that when displayed and possibly later post-processed, it was possible to accurately determine when a particular value or event occurred. With the amount of buffering, data loss and multiple-thread shenanigans, it is easy to forget that the data might get to the application in a non-deterministic way, and just relying on local CPU time is not so useful.

If you need to visualize data transported over the serial port, we have seen many projects to help. Like the highly configurable Serial Studio, for one. If your needs are a bit more complex, especially with multiple data transport methods, then a Supercon 2022 talk by [Alex Whittemore] might be a jolly good place to start.

Seeing Fireworks In A Different Light

If you’re worried that [Roman Dvořák]’s spectroscopic analysis of fireworks is going to ruin New Year’s Eve or the Fourth of July, relax — the science of this build only adds to the fun.

Not that there’s nothing to worry about with fireworks, of course; there are plenty of nasty chemicals in there, and we can say from first-hand experience that getting hit in the face and chest with shrapnel from a shell is an unpleasant experience. [Roman]’s goal with this experiment is pretty simple: to see if it’s possible to cobble together a spectrograph to identify the elements that light up the sky during a pyrotechnic display. The camera rig was mainly assembled from readily available gear, including a Chronos monochrome high-speed camera and a 500-mm telescopic lens. A 100 line/mm grating was attached between the lens and the camera, a finding scope was attached, and the whole thing went onto a sturdy tripod.

From a perch above Prague on New Year’s Eve, [Roman] collected a ton of images in RAW12 format. The files were converted to TIFFs by a Python script and converted to video by FFmpeg. Frames with good spectra were selected for analysis using a Jupyter Notebook project. Spectra were selected by moving the cursor across the image using slider controls, converting pixel positions into wavelengths.

There are some optical improvements [Roman] would like to make, especially in aiming and focusing the camera; as he says, the dynamic and unpredictable nature of fireworks makes them difficult to photograph. As for identifying elements in the spectra, that’s on the to-do list until he can find a library of spectra to use. Or, there’s always DIY Raman spectroscopy. Continue reading “Seeing Fireworks In A Different Light”

Scope GUI Made Easier

Last time, I assembled a Python object representing a Rigol oscilloscope. Manipulating the object communicates with the scope over the network. But my original goal was to build a little GUI window to sit next to the scope’s web interface. Had I stuck with C++ or even C, I would probably have just defaulted to Qt or maybe FLTK. I’ve used WxWidgets, too, and other than how many “extra” things you want, these are all easy enough to use. However, I had written the code in Python, so I had to make a choice.

Granted, many of these toolkits have Python bindings — PyQt, PySide, and wxPython come to mind. However, the defacto GUI framework for Python is Tkinter, a wrapper around Tk that is relatively simple to use. So, I elected to go with that. I did consider PySimpleGUI, which is, as the name implies, simple. It is attractive because it wraps tkinter, Qt, WxPython, or Remi (another toolkit), so you don’t have to pick one immediately. However, I decided to stay conservative and stuck with Tkinter. PySimpleGUI does have a very sophisticated GUI designer, though.

About Tkinter

The Tkinter toolkit lets you create widgets (like buttons, for example) and give them a parent, such as a window or a frame. There is a top-level window that you’ll probably start with. Once you create a widget, you make it appear in the parent widget using one of three layout methods:

  1. Absolute or relative coordinates in the container
  2. “Pack” to the top, bottom, left, or right of the container
  3. Row and column coordinates, treating the container like a grid

The main window is available from the Tk() method:

import tkinter as tk
root=tk.Tk()
root.title('Example Program')
button=tk.Button(root, text="Goodbye!", command=root.destroy)
button.pack(side='left')
root.mainloop()

That’s about the simplest example. Make a button and close the program when you push it. The mainloop call handles the event loop common in GUI programs.

Continue reading “Scope GUI Made Easier”

How To Talk To Your Scope

It used to be only high-end test equipment that had some sort of remote control port. These days, though, they are quite common. Historically, test gear used IEEE-488 (also known as GPIB or, from the originator, HPIB). But today, your device will likely talk over a USB port, a serial port, or a LAN connection. You’d think that every instrument had unique quirks, and controlling it would be nothing like controlling another piece of gear, especially one from another company. That would be half right. Each vendor and even model indeed has its unique command language. There has been a significant effort to standardize some aspects of test instrument control, and you can quickly write code to control things on any platform using many different programming languages. In a few posts, I will show you just how easy it can be.

The key is to use VISA. This protocol is defined by the IVI Foundation that lets you talk to instruments regardless of how they communicate. You do have to build an address that tells the VISA library how to find your device. For example: “TCPIP::192.168.1.92::INSTR.” But once you have that, it is easy to talk to any instrument anywhere.

I say that thinking it is a problem is half right because talking to the box is one task of the two you need to complete. The other is what to say to the box and what it will say back to you. There are a few standards in this area, but this is where you get into problems. Continue reading “How To Talk To Your Scope”

There’s No AI In A Markov Chain, But They’re Fun To Play With

Amid all the hype about AI it sometimes seems as though the world has lost sight of the fact that software such as ChatGPT contains no intelligence. Instead it’s an extremely sophisticated system for extracting plausible machine generated content from the corpus on which it is trained. There’s a long history behind machine generated text, and perhaps the simplest example comes in the form of a Markov chain. [Ben Hoyt] takes us through how these work, and provides some Python code so that you can roll your own.

If you’re uncertain what a Markov chain is, consider the predictive text on your phone. It works by offering the statistically most likely next word in your sentence, and should you accept all of its choices it will deliver sentences which are superficially readable but otherwise complete nonsense. He demonstrates with very simple short source texts how a collocate probability map is generated for two-word phrases, and how from that a likely next word can be extracted. It’s not AI, but it can be a lot of fun to play with and it opens the door to the entire field of computational linguistics. We haven’t set one loose on Hackaday’s archive yet but we suspect it would talk a lot about the Arduino.

We’re talking about Markov chains here with respect to language, but it’s also worth remembering that they work for music too.

Header: Bad AI image with Dall-E prompt, “Ten thousand monkeys with typewriters”.

Roll Your Own Python Debugger

Debugging might be the one thing that separates “modern” programming from “classic” programming. If you are on an old enough computer — or maybe one that has limited tools like some microcontrollers — debugging is largely an intellectual exercise. Try a program, observe its behavior, and then try again. You can liberally sprinkle print statements around if you have an output device or turn on LEDs or digital outputs if you don’t. But with a debugger, you can get a bird’s-eye view of your program’s data and execution flow.

For some languages, writing a debugger can be hard — you usually use at least some system facility to get started. But as [mostlynerdness] shows, Python’s interpreter wants to help you create your own debugger, and you can follow along to see how it’s done. This is accessible because Python has a built-in debugging core that you can use and extend. Well, regular Python, that is. MicroPython has some low-level support, and while we’ve seen attempts to add more, we haven’t tried it.

Of course, you may never need to build your own debugger — most of the IDEs have already done this for you, and some of the code is, in fact, lifted from an open code base and simplified. However, understanding how the debugging plumbing works may give you a leg up if you need to create custom logic to trap an error that would be difficult to find with a generic debugger. Plus, it is just darn interesting.

Like many Python things, there are some version sensitivities. The post is in four parts, with the last two dealing with newer API changes.

We can’t promise that Python can debug your hardware, though. We always thought the C preprocessor was subject to abuse, but it turns out that Python has the same problem.