Your Noisy Fingerprints Vulnerable To New Side-Channel Attack

Here’s a warning we never thought we’d have to give: when you’re in an audio or video call on your phone, avoid the temptation to doomscroll or use an app that requires a lot of swiping. Doing so just might save you from getting your identity stolen through the most improbable vector imaginable — by listening to the sound your fingerprints make on the phone’s screen (PDF).

Now, we love a good side-channel attack as much as anyone, and we’ve covered a lot of them over the years. But things like exfiltrating data by blinking hard drive lights or turning GPUs into radio transmitters always seemed a little far-fetched to be the basis of a field-practical exploit. But PrintListener, as [Man Zhou] et al dub their experimental system, seems much more feasible, even if it requires a ton of complex math and some AI help. At the heart of the attack are the nearly imperceptible sounds caused by friction between a user’s fingerprints and the glass screen on the phone. These sounds are recorded along with whatever else is going on at the time, such as a video conference or an online gaming session. The recordings are preprocessed to remove background noise and subjected to spectral analysis, which is sensitive enough to detect the whorls, loops, and arches of the unsuspecting user’s finger.

Once fingerprint patterns have been extracted, they’re used to synthesize a set of five similar fingerprints using MasterPrint, a generative adversarial network (GAN). MasterPrint can generate fingerprints that can unlock phones all by itself, but seeding the process with patterns from a specific user increases the odds of success. The researchers claim they can defeat Automatic Fingerprint Identification System (AFIS) readers between 9% and 30% of the time using PrintListener — not fabulous performance, but still pretty scary given how new this is.

A view of the inside of a car, with drivers wheel on the left and control panel in the middle, with red LED light displayed in the floor area under the drivers wheel and passenger side.

Bass Reactive LEDs For Your Car

[Stephen Carey] wanted to spruce up his car with sound reactive LEDs but couldn’t quite find the right project online. Instead, he wound up assembling a custom bass reactive LED display using an ESP32.

A schematic of the Bass LED reactive circuit, with an ESP32 on a breadboard connected to a KY-040 encoder module, a GY-MAX4466 microphone module and LED strips below.

The entirety of the build is minimal, consisting of a GY-MAX4466 electret microphone module, a KY-040 encoder for some user control and an ESP32 attached to a Neopixel strip. The only additional electronic parts are some passive resistors to limit current on the data lines and a capacitor for power line noise suppression. [Stephen] uses various enclosures from Thingiverse for the microphone, rotary encoder and ESP32 box to make sure all the modules are protected and accessible.

The magic, of course, is in the software, with the CircuitPythyon ulab library used to do the heavy lifting of creating the spectrogram and frequency filtering. [Stephen] has made the code is available on GitHub for those wanting to take a closer look.

It wasn’t very long ago that sound reactive LEDs used to be a heavy lift, requiring optimized FFT libraries or specialized components to do the spectrogram. With faster and cheaper microcontroller boards, we’re seeing many great projects, like the sensory bridge or Raspberry Pi driven LED spectrogram, that can now take spectrograms and Fourier transform calculations as basic infrastructure to build on top of them. We’re happy to see [Stephen] leverage the ESP32’s speed and various circuit Python libraries to create a very cool LED car hack.

Video after the break!

Continue reading “Bass Reactive LEDs For Your Car”

Identifying Malware By Sniffing Its EM Signature

The phrase “extraordinary claims require extraordinary evidence” is most often attributed to Carl Sagan, specifically from his television series Cosmos. Sagan was probably not the first person to put forward such a hypothesis, and the show certainly didn’t claim he was. But that’s the power of TV for you; the term has since come to be known as the “Sagan Standard” and is a handy aphorism that nicely encapsulates the importance of skepticism and critical thinking when dealing with unproven theories.

It also happens to be the first phrase that came to mind when we heard about Obfuscation Revealed: Leveraging Electromagnetic Signals for Obfuscated Malware Classification, a paper presented during the 2021 Annual Computer Security Applications Conference (ACSAC). As described in the mainstream press, the paper detailed a method by which researchers were able to detect viruses and malware running on an Internet of Things (IoT) device simply by listening to the electromagnetic waves being emanated from it. One needed only to pass a probe over a troubled gadget, and the technique could identify what ailed it with near 100% accuracy.

Those certainly sound like extraordinary claims to us. But what about the evidence? Well, it turns out that digging a bit deeper into the story uncovered plenty of it. Not only has the paper been made available for free thanks to the sponsors of the ACSAC, but the team behind it has released all of code and documentation necessary to recreate their findings on GitHub.

Unfortunately we seem to have temporarily misplaced the $10,000 1 GHz Picoscope 6407 USB oscilloscope that their software is written to support, so we’re unable to recreate the experiment in full. If you happen to come across it, please drop us a line. But in the meantime we can still walk through the process and try to separate fact from fiction in classic Sagan style.

Continue reading “Identifying Malware By Sniffing Its EM Signature”

Analyzing CNC Tool Chatter With Audacity

When you’re operating a machine that’s powerful enough to tear a solid metal block to shards, it pays to be attentive to details. The angular momentum of the spindle of a modern CNC machine can be trouble if it gets unleashed the wrong way, which is why generations of machinists have developed an ear for the telltale sign of impending doom: chatter.

To help develop that ear, [Zachary Tong] did a spectral analysis of the sounds of his new CNC machine during its “first chip” outing. The benchtop machine is no slouch – an Avid Pro 2436 with a 3 hp S30C tool-changing spindle. But like any benchtop machine, it lacks the sheer mass needed to reduce vibration, and tool chatter can be a problem.

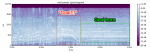
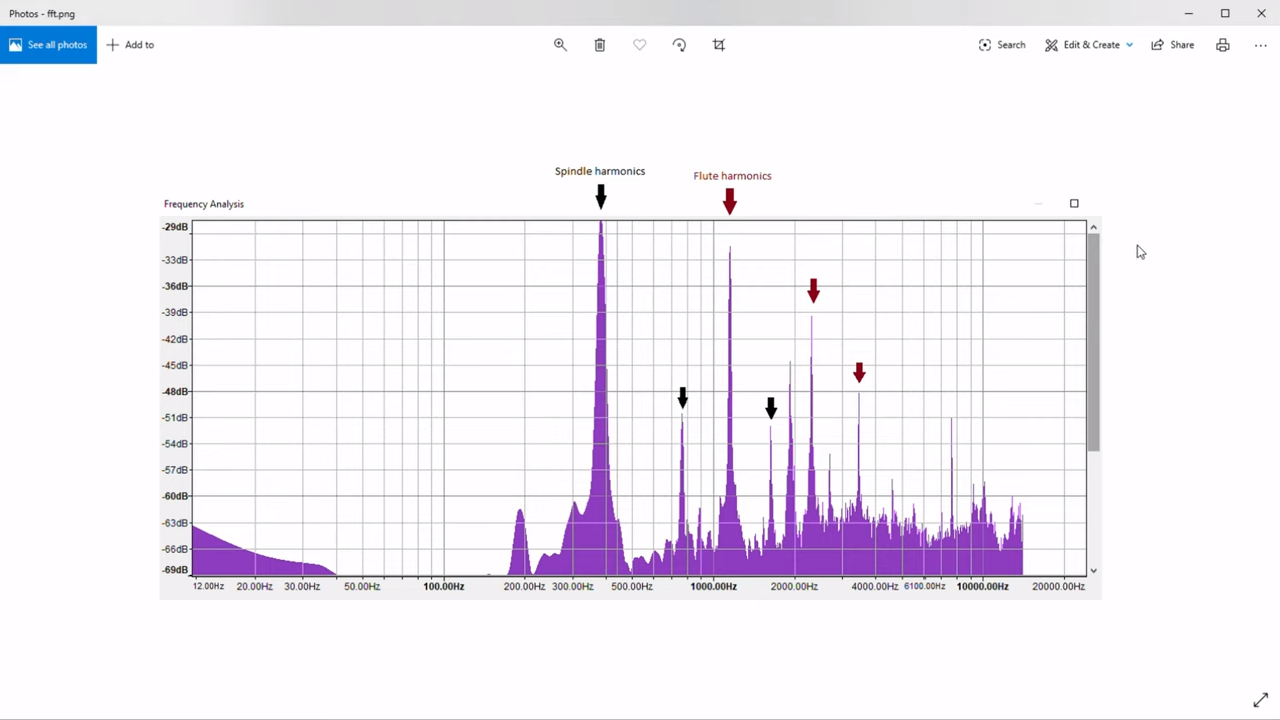
The analysis begins at about the 5:13 mark in the video below, where [Zach] fed the soundtrack of his video into Audacity. Switching from waveform to spectrogram mode, he was able to identify a strong signal at about 5,000 Hz, corresponding to the spindle coming up to speed. The white noise of the mist cooling system was clearly visible too, as were harmonic vibrations up and down the spectrum. Most interesting, though, was the slight dip in frequency during the cut, indicating loading on the spindle. [Zach] then analyzed the data from the cut in the frequency domain and found the expected spindle harmonics, as well the harmonics from the three flutes on the tool. Mixed in among these were spikes indicating chatter – nothing major, but still enough to measure.

Audacity has turned out to be an incredibly useful tool with a broad range of applications. Whether it be finding bats, dumping ROMs, detecting lightning strikes, or cloning remote controls, Audacity is often the hacker’s tool of choice.

Continue reading “Analyzing CNC Tool Chatter With Audacity”

Audio Algorithm Detects When Your Team Scores

[François] lives in Canada, and as you might expect, he loves hockey. Since his local team (the Habs) is in the playoffs, he decided to make an awesome setup for his living room that puts on a light show whenever his team scores a goal. This would be simple if there was a nice API to notify him whenever a goal is scored, but he couldn’t find anything of the sort. Instead, he designed a machine-learning algorithm that detects when his home team scores by listening to his TV’s audio feed.

goal[François] started off by listening to the audio of some recorded games. Whenever a goal is scored, the commentator yells out and the goal horn is sounded. This makes it pretty obvious to the listener that a goal has been scored, but detecting it with a computer is a bit harder. [François] also wanted to detect when his home team scored a goal, but not when the opposing team scored, making the problem even more complicated!

Since the commentator’s yell and the goal horn don’t sound exactly the same for each goal, [François] decided to write an algorithm that identifies and learns from patterns in the audio. If a home team goal is detected, he sends commands to some Phillips Hue bulbs that flash his team’s colors. His algorithm tries its best to avoid false positives when the opposing team scores, and in practice it successfully identified 75% of home team goals with 0 false positives—not bad! Be sure to check out the setup in action after the break.

Continue reading “Audio Algorithm Detects When Your Team Scores”

Video Voice Visualization

For their ECE 4760 final project at Cornell, [Varun, Hyun, and Madhuri] created a real-time sound spectrogram that visually outputs audio frequencies such as voice patterns and bird songs in gray-scale video to any NTSC television with no noticeable delay.

The system can take input from either the on-board microphone element or the 3.5mm audio jack. One ATMega1284 microcontroller is used for the audio processing and FFT stage, while a second ‘1284 converts the signal to video for NTSC output. The mic and line audio inputs are amplified individually with LM358 op-amps. Since the audio is sampled at 8KHz, a low-pass filter gets rid of frequencies above 4KHz.

After the break, you can see the team demonstrate their project by speaking and whistling bird calls into the microphone as well as feeding recorded bird calls through the line input. They built three controls into the project to freeze the video, slow it down by a factor of two, and convert between linear and logarithmic scales. There are also short clips of the recorded bird call visualization and an old-timey dial-up modem.

Continue reading “Video Voice Visualization”

Hammond Organ Sends Messages Which Can Be Decoded By A Spectrogram

hammond-organ-encodes-messages-spectrogram

Here’s an interesting use for an old organ. Let it get in on your Ham radio action. [Forrest Cook]  is showing off his project which uses a Hammond Organ to encode messages which can be displayed by a Spectrogram. We’ve seen this type of message encoding before (just not involving a musical instrument). It’s rather popular with Hams in the form of the fldigi program.

An Arduino was connected to the organ via a UNL2003 darlington array chip. This chip is driving some reed relays which make the organ connections to create the sine wave tones. With that hardware in place it’s a matter of formatting data to generate the target audio. [Forrest] wrote his own Arduino sketch which takes characters from the serial port (pushed over USB by the laptop), maps then to a stored 5×7 character font set, then drives the pins to produce the tones. As you can see in the clip after the break the resulting audio can be turned into quite readable text.

Continue reading “Hammond Organ Sends Messages Which Can Be Decoded By A Spectrogram”