
The Thermochromic Display You Didn’t Know You Needed

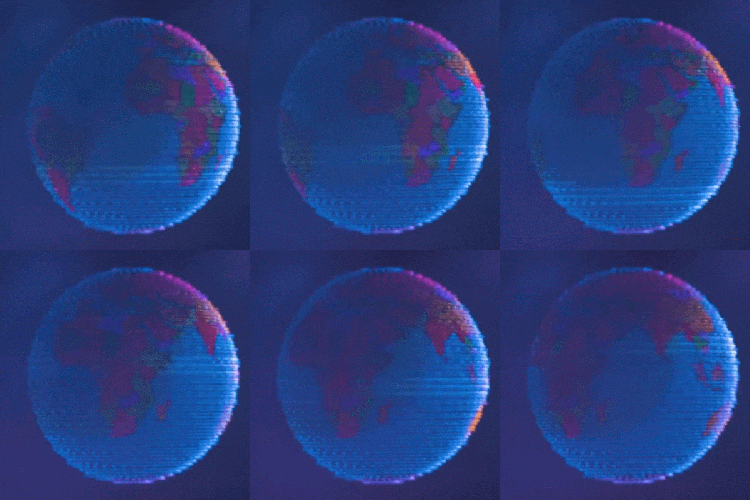
We love unique ways of displaying data here at Hackaday, and this ingenious thermochromic display created by [Moritz v. Sivers] more than fits the bill. Using sheets of color changing liquid crystals and careful temperature control of the plates they’re mounted on, he’s built a giant seven-segment display that can colorfully (albeit somewhat slowly) show the current temperature and humidity.

The sheets of temperature sensitive liquid crystals are a bit like flattened out Mood Rings; they starts out black, but as heat is applied, their color cycles through vibrant reds, greens, and blues. The sheets are perhaps best known as the sort of vaguely scientific toys you might see in a museum gift shop, but here [Moritz] has put their unique properties to practical use.

To achieve the effect, he first cut each segment out of copper. The crystal sheets were applied to the segments, thanks to their handy self-stick backing, and the excess was carefully trimmed away. Each segment was then mounted to a TES1-12704 Peltier module by way of thermally conductive epoxy. TB6612FNG motor controllers and a bevy of Arduino Nano’s are used to control the Peltier modules, raising and lowering their temperature as necessary to get the desired effect.

You can see the final result in the video after the break. It’s easily one of the most attractive variations on the classic seven-segment display we’ve ever seen. In fact, we’d go as far as to say it could pass for an art installation. The idea of a device that shows the current temperature by heating itself up certainly has a thoughtful aspect to it.

This actually isn’t the first display we’ve seen that utilized this concept, though it’s by far the largest. Back in 2014 we featured a small flexible display that used nichrome wires to “print” digits on a sheet of liquid crystals.

Continue reading “The Thermochromic Display You Didn’t Know You Needed”

Disappearing Writing With UV Laser Reveals Whitening Agents In Myriad Products

Many a budding maker has experimented with invisible inks, with a wide variety of solutions having a viable set of properties for this purpose. However, [Ben Krasnow] stumbled upon a different method entirely when tinkering with a UV laser.

The effect is subtle, but remains visible for several minutes.

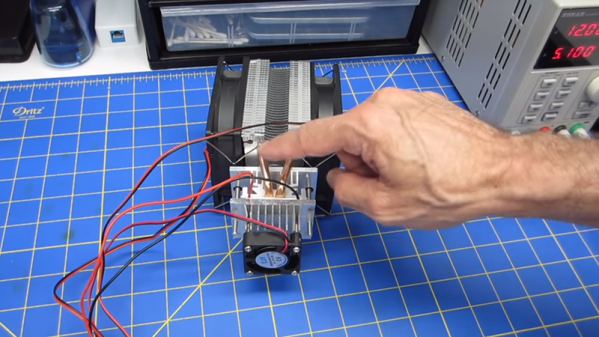
The laser in question was a MNL100 UV laser, configured to produce nanosecond-scale 20 kW pulses at up to 24 Hz, operating at wavelength of 337 nm, deep in the ultraviolet. After piping the laser light through an optical fiber and aiming it at some regular white paper, dark marks were observed, which disappear without a trace over the course of a few minutes.

Upon investigation, the dark marks seemed to be the result of fluorescent whitening agents in the paper. It appears they are overloaded or otherwise changed chemically by the laser, and slowly return back to normal over time. Further experiments showed that hydrogen peroxide was able to remove the marks instantly, and an argon atmosphere slowed the rate at which the marks faded.

It’s an interesting look at an odd chemical effect, with the benefit of a well-equipped optics lab to analyse what’s going on. Following the phenomenon down the rabbit hole leads to some tips on how to extract fluorescent additives from common laundry detergent. Be it paper, plastic, or textile, if it looks really bright white to your eye it probably contains stilbene organic compounds as optical brighteners, a hidden trait you never actually thought about before. Video after the break.

Continue reading “Disappearing Writing With UV Laser Reveals Whitening Agents In Myriad Products”

An All-Iron Battery Isn’t Light, But It’s Cheap

Rechargeable batteries are a technology that has been with us for well over a century, and which is undergoing a huge quantity of research into improved energy density for both mobile and alternative energy projects. But the commonly used chemistries all come with their own hazards, be they chemical contamination, fire risk, or even cost due to finite resources. A HardwareX paper from a team at the University of Idaho attempts to address some of those concerns, with an open-source rechargeable battery featuring electrode chemistry involving iron on both of its sides. This has the promise of a much cheaper construction without the poisonous heavy metal of a lead-acid cell or the expense and fire hazard of a lithium one.

A diagram of the all-iron cell.

The chemistry of this cell is split into two by an ion-exchange membrane, iron (II) chloride is the electrolyte on the anode side where iron is oxidised to iron 2+ ions, and Iron (III) chloride on the cathode where iron is reduced to iron hydroxide. The result is a cell with a low potential of only abut 0.6V, but at a claimed material cost of only $0.10 per kWh Wh of stored energy. The cells will never compete on storage capacity or weight, but this cost makes them attractive for fixed installations.

It’s encouraging to see open-source projects coming through from HardwareX, we noted its launch back in 2016.

Thanks [Julien] for the tip.

Memristor Computing On A Chip

Memristors have been — so far — mostly a solution looking for a problem. However, researchers at the University of Michigan are claiming the first memristor-based programmable computer that has the potential to make AI applications more efficient and faster.

Because memristors have a memory, they can accumulate data in a way that is common for — among other things — neural networks. The chip has both an array of nearly 6,000 memristors, a crossbar array, along with analog to digital and digital to analog converters. In fact, there are 486 DACs and 162 ADCs along with an OpenRISC processor.

Continue reading “Memristor Computing On A Chip”

A PKE Meter That Actually Detects Radiation

Fans of Ghostbusters will remember the PKE meter, a winged handheld device capable of detecting supernatural activity. Precious little technical data on the device remains, leaving us unable to replicate its functionality. However, the flashing, spreading wings serve as a strong visual indicator of danger, and [mosivers] decided this would be perfect for a Geiger counter build.

An SBM20 Geiger tube serves as the detection device, hooked up to an Arduino Nano. An OLED display is used to display the numerical data to the user. The enclosure and folding wings are 3D printed, and fitted with 80s-style yellow LEDs as per the original movie prop.

The device is quite intuitive in its use – if the wings flare out and the lights are flashing faster, you’re detecting an increased level of radiation. In a very real sense, it makes using a Geiger counter much more straightforward for the inexperienced or the hearing impaired. Naturally, there’s also a buzzer generating the foreboding clicks as you’d expect, too.

Geiger counters are a popular project, though we hope they don’t become common household items in the near future. Here’s a Fallout-inspired build for fans of the game. Video after the break.

Continue reading “A PKE Meter That Actually Detects Radiation”

Brain-Computer Interfaces: Separating Fact From Fiction On Musk’s Brain Implant Claims

When it comes to something as futuristic-sounding as brain-computer interfaces (BCI), our collective minds tend to zip straight to scenes from countless movies, comics, and other works of science-fiction (including more dystopian scenarios). Our mind’s eye fills with everything from the Borg and neural interfaces of Star Trek, to the neural recording devices with parent-controlled blocking features from Black Mirror, and of course the enslavement of the human race by machines in The Matrix.

And now there’s this Elon Musk guy, proclaiming that he’ll be wiring up people’s brains to computers starting next year, as part of this other company of his: Neuralink. Here the promises and imaginings are truly straight from the realm of sci-fi, ranging from ‘reading and writing’ to the brain, curing brain diseases and merging human minds with artificial intelligence. How much of this is just investor speak? Please join us as we take a look at BCIs, neuroprosthetics and what we can expect of these technologies in the coming years.

Continue reading “Brain-Computer Interfaces: Separating Fact From Fiction On Musk’s Brain Implant Claims”

Watch Earthquake Roll Across A Continent In Seismograph Visualization Video

If your only exposure to seismologists at work is through film and television, you can be forgiven for thinking they still lay out rolls of paper to examine lines of ink under a magnifying glass. The reality is far more interesting in a field that has eagerly adopted all available technology. A dramatic demonstration of modern earthquake data gathering, processing, and visualization was Tweeted by @IRIS_EPO following a central California quake on July 4th, 2019. In this video can see the quake’s energy propagate across the continental United States in multiple waves of varying speed and intensity. The video is embedded below, but click through to the Twitter thread too as it has a lot more explanation.

The acronym IRIS EPO expands out to Incorporated Research Institutions for Seismology, Education and Public Outreach. We agree with their publicity mission; more people need to know how cool modern seismology is. By combining information from thousands of seismometers, we could see forces that we could not see from any individual location. IRIS makes seismic data available to researchers (or curious data science hackers) in a vast historical database or a real time data stream. Data compilations are presented in several different forms, this particular video is a GMV or Ground Motion Visualization. Significant events like the 4th of July earthquake get their own GMV page where we can see additional details, like the fact this visualization compiled data from 2,132 stations.

If this stirred up interest in seismology, you can join in the fun of networked seismic data. A simple seismograph can be built from quite humble components, but of course there are specially designed chips for the task as well.

Continue reading “Watch Earthquake Roll Across A Continent In Seismograph Visualization Video”