Debug Superpowers Bring An STM32 Back From The Dead

When a processor has a fault it can leave what looks to be precious little in the way of cause and effect. Debug-by-print-statement works surprisingly well in simple cases, but where in a desktop environment you would drop into a debugger to solve trickier problems this can be an onerous task on an embedded system. [Ross Schlaikjer]’s excellent blog post walks through setting up one of our favorite Open Hardware debug probes and shows us that with the right tooling in place, unexpected faults aren’t quite so impenetrable. Continue reading “Debug Superpowers Bring An STM32 Back From The Dead”

Uncovering The Echo Dot’s Hidden USB Port

If you upgraded to Amazon’s latest Echo Dot, you might have been surprised to find that the diminutive voice assistant had shed its USB port. Earlier models of the Dot used a garden variety micro USB port for power, which hackers eventually figured out also provided a helpful way to snoop around inside the device’s firmware. The fact that the USB port was deleted on the latest Echo Dot in favor of a simple barrel connector for power was seen by some as a sign that Amazon was trying to keep curious owners out of their hardware.

But as [Brian Dorey] shows, all they did was put a bump in the road. While they removed the external USB connector, the traces for it are still on the board waiting to be accessed. Even better, it turns out the USB data lines are connected to the test points located on the bottom of the Dot. All you need is a simple breakout that will connect through the existing opening in the device’s case, and you’ve got your USB port back.

So what can you do with USB on the Echo Dot? Well, not much right now. [Brian] found that the Dot shows up as a Mediatek device under Linux using lsusb, and fastboot can see it and even confirms the presence of a locked bootloader. It’s going to take some work from the community to see how deep this particular rabbit hole goes.

Even if you’re not interested in restoring its USB port, [Brian] has uncovered a wealth of fascinating hardware information about the Echo Dot during his deep-dive. He’s mapped out many of the test points located throughout the device’s PCBs, and found a few interesting points that might be worth further investigation. For example, he found that driving one of the pins high would trigger the Dot to mute its microphones; which could be useful for anyone looking to cover Alexa’s ears.

[Brian] first cracked open the Echo Dot last month, after scoring one for cheap during Amazon’s Prime Day sale. It looks like he’s making fairly rapid progress on unraveling the mysteries of this popular gadget, and we’re very interested in seeing where this research takes us.

“DB” = Abbreviated Microcontroller Debugging

We’ve all been there. When debugging a microcontroller project, we just want to put in a print statement to figure out what’s going on with the microcontroller in real time. However, advanced embedded programmers know that printf statements are verboten: they’re just too SLOW. While not fixing this plight entirely, [Atakan Sarioglu] has come up with a clever way to create readable debug messages with minimal runtime overhead.

[Atakan Sarioglu]’s innovation, called BigBug (Github), is a dynamically-generated codebook. The codebook translates abbreviated messages sent over serial (UART here) to longer-form human-readable messages. To generate the codebook, BigBug automatically parses your comments to create a lookup between an abbreviation and the long-form message. When you are running your program on the microcontroller, BigBug will translate the short codes to long messages in real-time as you send log/debug data over serial. Continue reading ““DB” = Abbreviated Microcontroller Debugging”

Unlocking Animal Crossing’s Debug Mode

Originally released on the Nintendo 64 in 2001, Animal Crossing was the first entry into what has become a massively successful franchise. But while the game has appeared on more modern Nintendo consoles, most recently Android and iOS, the version released on the GameCube holds a special place in many fan’s hearts. The GameCube version was the first time those outside of Japan got a taste of the unique community simulation offered by Animal Crossing, and maintains a following nearly 20 years after its release.

[James Chambers] has recently been investigating creating mods for the GameCube version of Animal Crossing, and in the process uncovered some interesting references to a debug mode. That launched a deep dive into the game’s assembly code in an attempt to find what the debug functions did and if they could be enabled without having to patch the game ROM. In the end, he was able to find a push button code that enables debug mode on the retail copy of the game.

[James] starts by using the debugger provided by the Dolphin GameCube emulator to poke around and figure out exactly what flags need to be modified to activate the debug mode. This leads to a few interesting finds, such as being able to pop up a performance monitor graph and some build info. Eventually he finds the proper incantation to bring up a functional debug display in the game, but there was still the mystery of how you do it on the real hardware with a retail copy of the game.

It wouldn’t be unreasonable to think that some special dongle or development version of the GameCube would be required to kick the game into debug mode. But through careful examination of the code path, [James] was able to figure out that hitting a specific combination of buttons on the controller was all that was required to use the debug mode on the stock game. Once the debug mode is started, a controller plugged into the second port allows the user to navigate through options and perform tasks. Not everything is currently understood, but some progress has been made, such as figuring out how to add items to your inventory.

It’s hardly Nintendo’s most popular console, but there’s still a healthy interest in GameCube hacking as the machine approaches its 20th anniversary. We recently saw some impressive work being done to reverse engineer the system’s wireless controllers, though some people are more interested in just cutting the thing in half.

[Thanks to Tim Trzepacz for the tip.]

Rubber Duck Debugging The Digital Way

Anyone who slings code for a living knows the feeling all too well: your code is running fine and dandy one minute, and the next minute is throwing exceptions. You’d swear on a stack of O’Reilly books that you didn’t change anything, but your program stubbornly refuses to agree. Stumped, you turn to the only one who understands you and pour your heart out to a little yellow rubber duck.

When it comes to debugging tools, this digital replacement for the duck on your desk might be even more helpful. Rubber duck decoding, where actually explaining aloud to an inanimate object how you think the code should run, really works. It’s basically a way to get you to see the mistake you made by explaining it to yourself; the duck or whatever – personally, I use a stuffed pig– is just along for the ride. [platisd] took the idea a step further and made his debugging buddy, which he dubs the “Dialectic Ball,” in the form of a Magic 8-Ball fortune teller. A 3D-printed shell has an ATtiny84, an accelerometer, and an LCD screen. To use it, you state your problem, shake it, and read the random suggestion that pops up. The list has some obvious suggestions, like adding diagnostic print statements or refactoring. Some tips are more personal, like talking to your local guru or getting a cup of coffee to get things going again. The list can be customized for your way of thinking. If nothing else, it’ll be a conversation piece on your desk.

If you’re more interested in prognostication than debugging, we have no shortage of Magic 8-Ball builds to choose from. Here’s one in a heart, one that fits in a business card, and even one that drops F-bombs.

Continue reading “Rubber Duck Debugging The Digital Way”

Flash And Debug ESP8266 Boards On Android

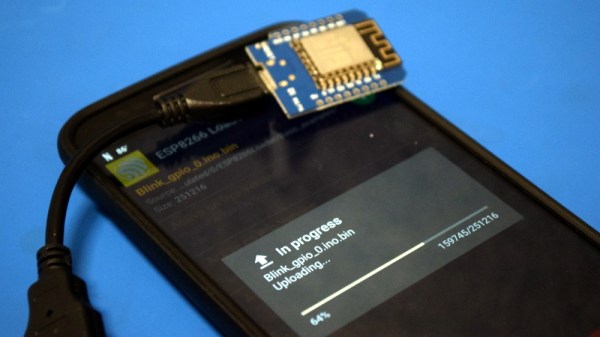
Have an ESP8266 development board such as the NodeMCU or Wemos D1? You’re currently reading Hackaday, so probably. Got an Android device kicking around? Also seems fairly likely. In that case, you should check out ESP8266 Loader by [Bluino Electronics]. This recently released application lets you not only flash new binaries to any ESP8266 board using the FTDI, PL2303, CH34X and CP210X USB chipsets, but also offers a serial monitor for debugging on the go.

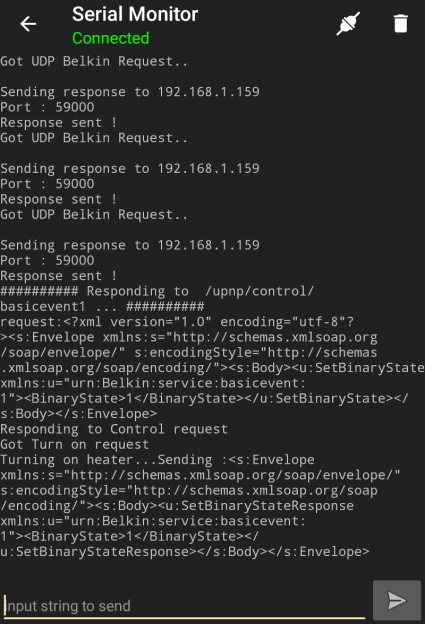
You’ll need a USB OTG cable to get your ESP board jacked in to your Android device, but you don’t need root or even to fiddle with the development settings. Here at the Hackaday R&D Dungeon we had somewhat mixed success getting a random selection of Android devices to work fully; all of the ones tried could at least open the serial monitor and read what a pre-programmed ESP was saying, but not all of them could successfully program a board.

Even on the devices where programming worked, it was slow. Just a basic LED blinking Sketch took long enough to write to our test Wemos D1 Mini that we contemplated getting a snack. But still, it shows a lot of promise for managing devices in the field, especially if you don’t have over the air update enabled in your code.

We especially liked that ESP8266 Loader helpfully downloaded a bunch of example binaries, many of which could be of practical use. There are programs for toggling the different GPIO pins on the board, creating Wi-Fi access points, and even a basic web server. With these in hand, you could actually do some testing and diagnostic work right from your mobile device.

This isn’t the first time we’ve seen an ESP8266 team up with a mobile device, but generally speaking, the magic is done over WiFi or Bluetooth.

Dissecting The AVR DebugWire

Anyone who’s ever written more than a dozen or so lines of code knows that debugging is a part of life in our world. Anyone who’s written code for microcontrollers knows that physical debugging is a part of our life as well. Atmel processors use a serial communications protocol called debugWire, which is a simpler version of JTAG and allows full read/write access to all registers and allows one to single step, break, etc. [Nerd Ralph], a prominent fixture here at Hackaday has dug into the AVR debugWire protocol and enlightened us with some valuable information.

While the protocol side of debugWire is a mostly-solved problem, the physical layer was giving him trouble. He started with a diode, and then went through a couple resistors and other components to interface with the debugWire pin on the AVR microcontroller, doing most of the troubleshooting work so now you don’t have to. He notes that interface components might need to be tailored to specific USB-TTL adapters, so keep that in mind if you care to delve into working with debugWire yourself.

We’re no strangers to debugging techniques here at Hackaday. As always, be sure to let us know if you run across any new techniques or try anything new yourself!