Debugging With Serial Print At 5333333 Baud

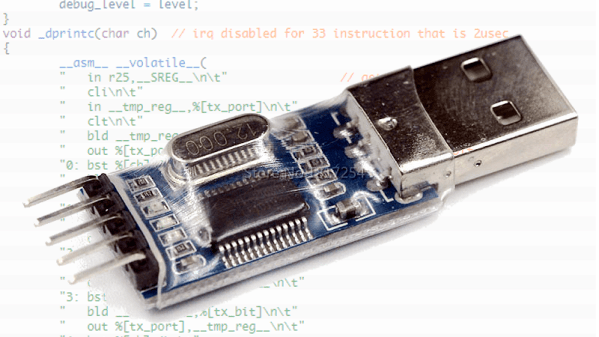
Debugging with printf is something [StorePeter] has always found super handy, and as a result he’s always been interested in tweaking the process for improvements. This kind of debugging usually has microcontrollers sending messages over a serial port, but in embedded development there isn’t always a hardware UART, or it might already be in use. His preferred method of avoiding those problems is to use a USB to Serial adapter and bit-bang the serial on the microcontroller side. It was during this process that it occurred to [StorePeter] that there was a lot of streamlining he could be doing, and thanks to serial terminal programs that support arbitrary baud rates, he’s reliably sending debug messages over serial at 5.3 Mbit/sec, or 5333333 Baud. His code is available for download from his site, and works perfectly in the Arduino IDE.

The whole thing consists of some simple, easily ported code to implement a bare minimum bit-banged serial communication. This is output only, no feedback, and timing consists of just sending bits as quickly as the CPU can handle, leaving it up to the USB Serial adapter and rest of the world to handle whatever that speed turns out to be. On a 16 MHz AVR, transmitting one bit can be done in three instructions, which comes out to about 5333333 baud or roughly 5.3 Mbit/sec. Set a terminal program to 5333333 baud, and you can get a “Hello world” in about 20 microseconds compared to 1 millisecond at 115200 baud.

He’s got additional tips on using serial print debugging as a process, and he’s done a followup where he stress-tests the reliability of a 5.3 MBit/sec serial stream from an ATMega2560 at 16 MHz in his 3D printer, and found no missed packets. That certainly covers using printf as a debugger, so how about a method of using the debugger as printf?

Backchannel UART Without The UART

Anyone who has worked with a microcontroller is familiar with using printf as a makeshift debugger. This method is called tracing and it comes with the limitation that it uses up a UART peripheral. Believe it or not, there are 8051 variants out there that come with only one serial block and you are out of luck if your application needs it to communicate with another device.

[Jay Carlson] has a method by which he can piggyback these trace messages over an on-chip debugger. Though the newer ARM Cortex-M software debugger already has this facility but [Jay Carlson]’s hack is designed to work with the SiLabs EFM8 controllers. The idea is to write these debug messages to a predefined location in the RAM which the debugger can access anyway. His application polls a certain area of the memory and when it finds valid information, it reads the data and spits it out into a dedicated window. It’s using the debugger as a makeshift printf!

[Jay Carlson] used slab8051.dll interface and put together a C# program and GUI that works alongside the SiLab’s IDE. The code is available on GitHub for you to check out if you are working the EFM8 and need a helping hand. The idea is quite simple and can be ported to other controllers in a multitude of ways like the MSP430 perhaps. For those of you who like the Teensy, you might want to take a look at adding debugger support to the Teensy 3.5/3.6.

The Many Faces Of JTAG

Wouldn’t it be great if there were just one standard for attaching to, programming, and debugging hardware?  If you could just plug in and everything would just work? Dream on, dreamer! But of course we hobbyists aren’t the only people to suffer from multiple standards. Industry has the same problems, writ large. In response to the proliferation of smart devices — microcontrollers, sensors, and their friends — on any given PCB makes it difficult to test them all, much less their function as a system.

The Joint Test Action Group (JTAG) got together in the mid-80s to make automated testing of circuit boards a standardized process. A JTAG port can be found on almost any piece of consumer electronics with enough brains to warrant it, and it’s also a tremendously useful entry point for debugging your own work and hacking into other’s. You’re going to need to use JTAG someday.

Implemented right, it’s a very cool system that lets you test any compliant IC on the board all from a single connector. It’s mostly used by hackers for its ability to run and halt individual processors, and put them in debugging modes, inspecting their memory states, etc. Essentially every microcontroller responds to JTAG commands, and it’s an incredibly widespread and powerful standard. A victory for rationality and standardization!

The connector pinout was, of course, left up to the manufacturer. The horror!

Five Signals

In principle, JTAG uses five signal lines. They form a chain starting at the debugger, where one device’s output is the next device’s input, until the result is returned back to the debugger.

654px-jtag_chain
JTAG, as imagined by Vindicator CC BY 2.5
  • Test Data In (TDI) is the input from the debugger
  • Test Data Out (TDO) is the return end of the chain
  • Test Clock (TCK) clocks this data along synchronously, similarly to SPI
  • Test Mode Select (TMS) lets the devices know that they’re being debugged — it’s a global chip select
  • Test Reset (TRST) is an optional signal that resets all devices in the chain

Continue reading “The Many Faces Of JTAG”

TP-Link Debug Protocol Gives Up Keys To Kingdom

If the headline makes today’s hack sound like it was easy, rest assured that it wasn’t. But if you’re interested in embedded device hacking, read on.

[Andres] wanted to install a custom OS firmware on a cheap home router, so he bought a router known to be reflashable only to find that the newer version of the firmware made that difficult. We’ve all been there. But instead of throwing the device in the closet, [Andres] beat it into submission, discovering a bug in the firmware, exploiting it, and writing it up for the manufacturer.  (And just as we’re going to press: posting the code for the downgrade exploit here.)

This is not a weekend hack — this took a professional many hours of serious labor. But it was made a lot easier because TP-Link left a debugging protocol active, listening on the LAN interface, and not requiring authentication. [Andres] found most of the information he needed in patents, and soon had debugging insight into the running device.

Continue reading “TP-Link Debug Protocol Gives Up Keys To Kingdom”

Black Magic Probe: The Best ARM JTAG Debugger?

We don’t always JTAG, but when we do, we use a Black Magic Probe. It’s a completely open ARM-chip debugging powerhouse. If you program the small ARM chips and you don’t have a BMP, you need a BMP. Right now, one of the main producers of these little gems is running a Kickstarter where you can get your hands on a nicely made one and/or a 1Bitsy STM32F415-based development board.

Why is the BMP so great? First off, it’s got a JTAG and a UART serial port in one device. You can flash the target, run your code, use the serial port for printf debugging like you know you want to, and then fall back on full-fledged JTAG-plus-GDB when you need to, all in one dongle. It’s just very convenient.

But the BMP’s killer feature is that it runs a GDB server on the probe. It opens up a virtual serial port that you can connect to directly through GDB on your host computer. No need to hassle around with OpenOCD configurations, or to open up a second window to run [texane]’s marvelous st-util. Just run GDB, target extended-remote /dev/ttyACM0 and you’re debugging. As the links above demonstrate, there are many hardware/software pairs that’ll get you up and debugging. But by combining the debug server with the JTAG hardware, the BMP is by far the slickest.

Full disclosure: we use a BMP that we built ourselves, which is to say that we compiled and flashed the firmware into a $4 STLink clone programmer that we had on hand. Breaking the required signals out required a bit of ugly, fiddly soldering, but we enjoy that sort of thing. If you don’t, the early-bird Kickstarter (with cables) looks like a good deal to us.

UController Code Profiler Debugs Your Microcontroller

When working on digital circuits that operate at high frequencies it helps to have some special tools on hand. Things like oscilloscopes and logic analyzers are priceless when something isn’t working right. Another great tool would be this hardware-based profiler that [Mike] came up with while he was working on another project.

The profiler connects to USB and shows up as a serial port. Normally [Mike] used a set of LEDs to get information about how his microcontrollers work, but for this project that wasn’t enough. The uController Code Profiler can provide the main loop running time, time functions and sections of code, keep track of variables, and a few other tasks as well, all with nanosecond resolution.

The source code isn’t provided but a hex file is available, along with a schematic and an include file, if you want to try this one out on your next project. Like this homemade logic analyzer, this could be a powerful tool in your microcontroller arsenal. Simply include the file with various pieces of your code to get it up and running!

Excel Password

Breaking Dridex Malware With Excel Macro Password Exploit

[Ronnie] recently posted a new chapter in his adventures in malware deconstruction. This time the culprit was an infected Excel spreadsheet file. The .xls file was attached to a phishing email claiming to be related to a tax rebate. With tax season in full swing, this type of phishing message would be likely to be opened by an inexperienced user.

[Ronnie] saved the file to a virtual machine to prevent his real workstation from getting infected. He then opened it up in Excel and noticed that it immediately attempted to run macros. A macro is essentially visual basic scripting that runs inside of the spreadsheet file. You can use it for simple automation, cell formatting, or do even more complicated tasks like reach out to external websites and pull information. This malware focused on the latter.

[Ronnie] used the alt + F11 shortcut to view the macros. Unfortunately the attackers had password protected them. [Ronnie] wouldn’t be able to view the macro code without knowing the password. Luckily, he learned of a surprisingly simple trick to completely bypass the macro password. He opened up the .xls file in Notepad++ and located three keys; CMG, DPB, and G. [Ronnie] then created and saved a new blank .xls document and password protected the macros with his own password. He opened up this new file in Notepad++ as well, and located those same three keys. He copied the keys from the new file into the old one, and saved the old file. This effectively changed the password of the malware file to the new one he had set for his new file. This is a nifty trick that apparently only works on the older .xls formats, not the newer .xlsx format.

After loading the macros, [Ronnie] quickly noticed that most of the code was obfuscated to make it difficult to analyze. There were, however, three named modules that reference possible sandbox evasion techniques. The malware first invokes these functions to detect the presence of a virtual machine or other type of sandbox. If it detects nothing, then the rest of the malware program is decoded and executed. [Ronnie] removed these checks and then executed the macro to verify that his change had worked.

The next step was to try to view the decoded instructions. The decoded gibberish was saved to a variable. The simplest way for [Ronnie] to view the contents of the variable was to have the program create a pop-up box that displayed the contents of that variable. After making this change and running the program again, he was able to see exactly what the malware was doing. The code actually invoked Powershell, downloaded a file from the Internet, and then extracted and executed that file. In the full write-up, [Ronnie] goes even further by downloading and analyzing the executable.