We don’t know about you, but we have mixed feelings about online puzzle fads. On one hand, they are great tool to help keep one sharp, but they’re just everywhere. The latest social-media driven fad, Wordle, may be a little bit too prevalent for our liking, with social media timelines stuffed with updates about the thing. [Ed Locard] was getting a bit miffed with friends’ constant posts about ‘Today’s Wordle’, and was hoping they’d get back to posting pictures of their dogs instead, so did what any self-respecting hacker would do, and wrote a python script to automate solving Wordle puzzles, in a likely futile attempt to get them to stop posting.
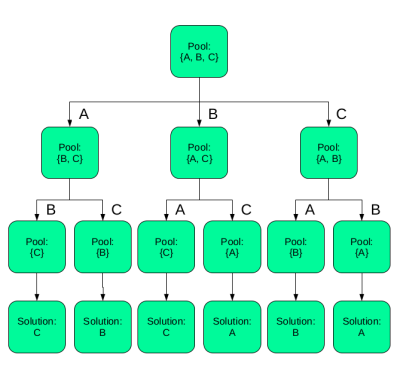
Actually, [Ed] was more interested in building a solver for a related game, Absurdle, which is described as an adversarial variant of Wordle. This doesn’t actually select a single word, but uses your guesses so far to narrow down a large pool of possible words, keeping you guessing for longer. Which is pretty mean of it. Anyway, [Ed] came up with a tool called Pyrdle, (GitHub project) which is essentially a command version of Absurdle, that has the capability of also solving Wordle as a byproduct. It turns out the JS implementation of Wordle holds the entire possible wordlist, client-side, so the answer is already sitting in your browser. The real interest part of this project is the approach to automated problem solving of puzzles with a very large potential set of solutions. This makes for an interesting read, and infinitely more so than reading yet another Wordle post.
And one final note; if you’re not at all onboard with this, love Wordle, and can’t get enough, you might like to install [brackendawson]’s comically titled (command) notfoundle shell handler, for some puzzling feedback on your command-line slip-ups. Well, it amused us anyway.
Puzzle projects hit these pages once in a while. Here’s the annual Xmas GCHQ puzzle, If you’re more into physical puzzles, with an electronics focus (and can solder) check out the DEF CON 29 puzzle badge!
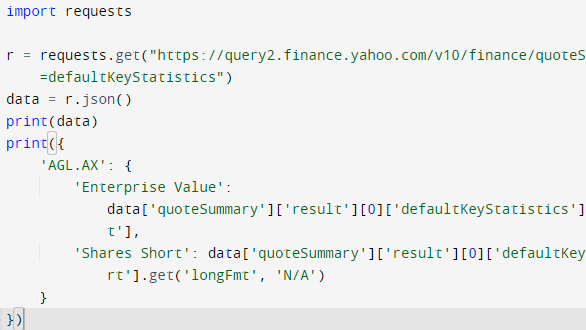
 [Doug] shows that while parsing a web page for a specific piece of data (for example, a stock price) is not difficult, there are sometimes easier and faster ways to go about it. In the case of Yahoo Finance, the web page most of us look at isn’t really the actual source of the data being displayed, it’s just a front end.