Cyberattack On Florida City’s Water Supply

The city of Oldsmar, Florida was the source of disturbing news this week, among reports that someone gained unauthorized access to a water treatment facility. In an era where more systems than ever are connected to the Internet, the story is a sobering one for the vast majority of people reliant on grid utilties.

The hacker was first noticed to have gained remote access to a computer system at the plant at 8 a.m. on February 5. An operator at a workstation controlling chemical dosing at the plant observed a remote connection, though did not initially raise the alarm as such access is common practice at the facility for troubleshooting purposes. However, at 1:30 pm, the hacker connected again, this time commanding the dosing system to raise levels of sodium hydroxide in the water from 100 to 11,000 ppm – dangerous levels that would make the city’s water unsafe to drink. The increased level command was immediately overridden by the operator, who then raised the alarm.

The city notes that other safeguards such as pH monitors at the plant would have triggered in the event the original intrusion went undetected. However, the event raises renewed questions about the level of security around critical utility systems connected to the internet. In the last decade, cyberattacks on physical infrastructure have become a reality, not a vague future threat.

Nothing’s known yet about the perpetrator, or how secure the system was (or wasn’t?) before the event. It’s been long known that a lot of infrastructure is simply connected to the internet, as Dan Tentler has been showing us since at least 2012. (Video, ranting.)  Indeed, it’s amazing that we’ve seen so few malicious attacks.

Sewage Maceration Is As Gross As It Sounds

Day to day, few of us really contemplate what’s happening on a deep, mechanical level when we use the toilet. The business is done, the toilet is flushed, and we go about our day. However, the magnificent technology of indoor sanitation should not be sniffed at, given the manner in which it facilitates a cleaner, more comfortable existence for us all.

The vast majority of flush toilets rely on the benefit of gravity to remove waste from the house. This necessitates that the toilet be installed above the sewage lines that exit the house. For most installations at ground floor and above, this isn’t a problem. However, on occasions you may encounter basements or houses with rooms at lower levels where a regular toilet simply won’t work. Obviously, a pump is in order, but human sewage being a mixture of liquids and solids makes this impractical. Instead, it must be turned into a slurry that can be pumped; a process known as sewage maceration. Buckle up!

Continue reading “Sewage Maceration Is As Gross As It Sounds”

Reading The Water Meter In A Literal Sense With An ESP8266

In our info-obsessed culture, hackers are increasingly interested in ways to quantify the world around them. One popular project is to collect data about their home energy or water consumption to try and identify any trends or potential inefficiencies. For safety and potentially legal reasons, this usually has to be done in a minimally invasive way that doesn’t compromise the metering done by the utility provider. As you might expect, that often leads to some creative methods of data collection.

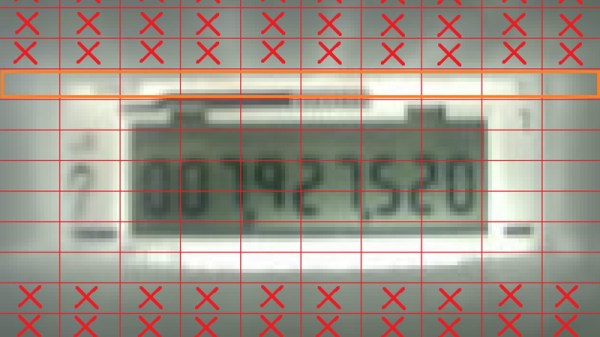
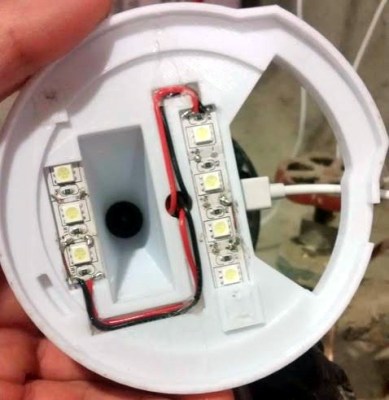
The latest solution comes courtesy of [Keilin Bickar], who’s using the ESP8266 and a serial TTL camera module to read the characters from the LCD of his water meter. With a 3D printed enclosure that doubles as a light source for the camera, the finished device perches on top of the water meter and sends the current reading to HomeAssistant via MQTT without any permanent wiring or mounting.

Of course, the ESP8266 is not a platform we generally see performing optical character recognition. Some clever programming was required to get the Wemos D1 Mini Lite to reliably read the numbers from the meter without having to push the task to a more computationally powerful device such as a Raspberry Pi. The process starts with a 160×120 JPEG image provided by a VC0706 camera module, which is then processed with the JPEGDecoder library. The top and bottom of the image are discarded, and the center band is isolated into blocks that correspond with the position of each digit on the display.

Within each block, the code checks an array of predetermined points to see if the corresponding pixel is black or not. In theory this allows detecting all the digits between 0 and 9, though [Keilin] says there were still the occasional false readings due to inherent instabilities in the camera and mounting. But with a few iterations to the code and the aid of a Python testing program that allowed him to validate the impact of changes to the algorithm, he was able to greatly improve the detection accuracy. He says it also helps that the nature of the data allows for some basic sanity checks;  for example the number only ever goes up, and only by a relatively small amount each time.

This method might not allow the per-second sampling required to pull off the impressive (if slightly creepy) water usage data mining we saw recently, but as long as you’re not after very high resolution data this is an elegant and creative way to pull useful data from your existing utility meter.

Knowing What’s Below: Buried Utility Location

We humans have put an awful lot of effort into our infrastructure for the last few centuries, and even more effort into burying most of it. And with good reason — not only are above ground cables and pipes unsightly, they’re also vulnerable to damage from exposure to the elements. Some utilities, like natural gas and sanitary sewer lines, are also dangerous, or at least perceived to be so, and so end up buried. Out of sight, out of mind.

But humans love to dig, too, and it seems like no sooner is a paving project completed than some joker with a jackhammer is out there wrecking the pristine roadway. Before the construction starts, though, cryptic markings will appear on the pavement courtesy of your local buried utility locating service, who apply their rainbow markings to the ground so that nothing bad happens to the often fragile infrastructure below our feet.

Continue reading “Knowing What’s Below: Buried Utility Location”

Power Meter

Solar Panel System Monitoring Device Using Arduino

[Carl] recently upgraded his home with a solar panel system. This system compliments the electricity he gets from the grid by filling up a battery bank using free (as in beer) energy from the sun. The system came with a basic meter which really only shows the total amount of electricity the panels produce. [Carl] wanted to get more data out of his system. He managed to build his own monitor using an Arduino.

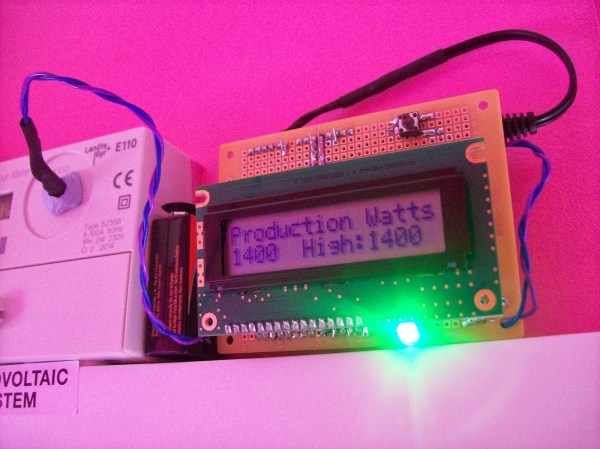
The trick of this build has to do with how the system works. The panel includes an LED light that blinks 1000 times for each kWh of electricity. [Carl] realized that if he could monitor the rate at which the LED is flashing, he could determine approximately how much energy is being generated at any given moment. We’ve seen similar projects in the past.

Like most people new to a technology, [Carl] built his project up by cobbling together other examples he found online. He started off by using a sketch that was originally designed to calculate the speed of a vehicle by measuring the time it took for the vehicle to pass between two points. [Carl] took this code and modified it to use a single photo resistor to detect the LED. He also built a sort of VU meter using several LEDs. The meter would increase and decrease proportionally to the reading on the electrical meter.

[Carl] continued improving on his system over time. He added an LCD panel so he could not only see the exact current measurement, but also the top measurement from the day. He put all of the electronics in a plastic tub and used a ribbon cable to move the LCD panel to a more convenient location. He also had his friend [Andy] clean up the Arduino code to make it easier for others to use as desired.

[Ben Krasnow] Explains Kilowatt Hour Meters

benkrazpowermeter

[Ben Krasnow] is back, and this time he’s tearing down a kilowatt hour meter (kWh). While not as exciting as making aerogel at home, or a DIY scanning electron microscope, [Ben’s] usual understated style of explaining things makes a complex topic simple to digest.

These old mechanical meters have been a staple on the sides of houses and businesses since the dawn of commercial power. We always thought the meters were a basic electric motor. Based upon [Ben’s] explanation though, these meters are a complex dance of electromagnetic fields. Three coils create magnetic fields near an aluminum disk. This creates eddy currents in the disk resulting in a net torque. The disk spins, turning a clockwork and advancing the dials.

Why three coils? One is a high turn high gauge voltage coil, and the other two are low turn low gauge current coils. The voltage coil has to be phase shifted 90 degrees to create the proper torque on the disk. Confused yet? Watch the video! [Ben] does a much better job explaining the field interactions than we could ever do in text.

Continue reading “[Ben Krasnow] Explains Kilowatt Hour Meters”

Gas, Water, And Electricity Monitoring

???????????????????????????????

From the look of this you can tell that [Jasper Sikken] has some pretty interesting stuff going on to monitor the utilities in his home. But it’s important to note that this is a rental home. So adding sensors to the gas, water, and electric meters had to be done without making any type of permanent changes.

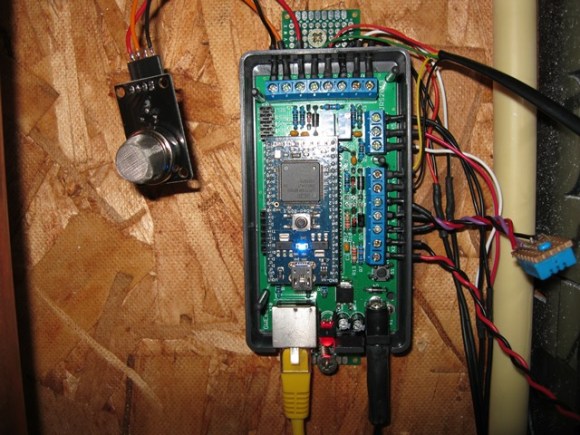
The module above is his own base PCB which accepts an mbed board to harvest and report on usage. His electric meter has an LED that will flash for every Watt hour that is used. He monitors that with a light dependent resistor, crafting a clever way to fasten it to the meter using four magnets. The water meter has a disc that makes one revolution for each liter of water that passes through it. Half of the disc is reflective so he uses a photoreflective sensor to keep track of that. And finally the gas meter has a reflective digit on one of the wheels. The sensor tracks each time this digit passes by, signifying 10 liters of gas used. He also monitors temperature which we’re sure comes in handy when trying to make sense of the data.

[Thanks Stephen]